
If you are not using virtual events in your marketing strategy, you are wrong! As the world becomes increasingly digital, virtual events are exploding with growth and opportunity.
Even marketers prefer virtual events to in-person events. 75% of them say it’s easier to create content for virtual events than physical events.
From skyrocketing attendance rates to staggering revenue boosts, the virtual event statistics are in. These events are upgrading how we connect, collaborate, and do business.
Let’s examine the interesting virtual event statistics and discover the latest trends, insights, and numbers shaping the future of events. If you haven’t used virtual events yet, these statistics will inspire you to do so.
Top Virtual Event Statistics & Facts (Editor’s Pick)
- The primary reason why people attend virtual events is to learn more about the company and the product.
- 73% of marketers rated virtual events as a top priority, deeming them either “important” or a “must-have.”
- US Virtual Event Planners’ average hourly pay is $30.45.
- In the previous two years, there has been a 66% increase in webinar live attendance.
- 57.7% of businesses plan on increasing their budget for online events.
- 80% of B2B marketers say their website is the most effective marketing channel.
- 85% of marketers consider attendee satisfaction as a success factor.
- 46% of marketers agree that events and webinars are the most effective tools for generating awareness and interest in their products and services.
- For virtual events, 90% of marketers report increased attendance, 83% see a boost in brand awareness, and 77% achieve better lead generation results.
- 96% of marketers see virtual events as a key driver for advancing DEI objectives.
- According to 89% of marketers, webinars were more effective than other channels in generating qualified leads.
- 75% of marketers find developing content for virtual events simpler than in-person events.
General Virtual Event Statistics
1. The Virtual Events Market is surging, expanding from $44.28 billion in 2024 to $231 billion by 2031, with a staggering 25.30% annual growth rate. (source)
2. 74% of businesses say virtual events are essential to their overall marketing strategy. (source)
3. South Korea’s virtual events market is expected to experience rapid expansion, with a forecasted growth rate of 23.10% per year from 2024 to 2032. (source)
4. The global exhibition market is projected to expand from $66.33 billion in 2024 to $95.22 billion by 2031, growing at a compound annual growth rate (CAGR) of 5.1% during that period. (source)
5. 43% of attendees plan to attend more virtual conferences. However, 48% plan to attend in-person events, and 41% say they will attend virtual roundtables. (source)
6. 94% of surveyed companies planned to host virtual events in 2022. (source)
7. The primary reason why people attend virtual events is to learn more about the company and the product. (source)
8. 99% of over 2000 surveyed small businesses say hosting webinars is in their marketing plan. (source)
9. The event management software market size is estimated to grow by USD 2.77 billion at a CAGR of 8.21% between 2023 and 2028. (source)
10. The US event management software market is expected to grow at a rate of 4.96% per year from 2024 to 2032. (source)
11. After 2020, 40% of events were expected to be virtual events, 36% were expected to be physical events, and 24% were expected to be hybrid events. (source)
12. The virtual events market in Southeast Asia is expected to grow at a remarkable rate of 24.52% per year from 2024 to 2032. (source)
13. Virtual events reigned supreme in 2023, outpacing hybrid and in-person events. 73% of marketers rated virtual events as a top priority, deeming them either “important” or a “must-have.” (source)
14. In-person events saw a significant decline in attendance (89%) and a notable increase in costs (70%), leading to a shift in preference towards virtual events. (source)
15. Marketers personalize virtual events by recommending content (52%), offering curated promotions (45%), and creating personalized agendas (42%). (source)
16. According to ZipRecruiter, US Virtual Event Planners’ average hourly pay is $30.45, as of November 7, 2024. (source)
Virtual Event Attendance Rate Statistics
17. 41% of respondents in a U.S. survey had no interest in attending virtual live music events in the metaverse. However, Millennials (32% somewhat interested, 29% very interested) and Gen Z (32% somewhat interested) showed more enthusiasm, while Baby Boomers were the least interested. (source)
18. In the previous two years, there has been a 66% increase in webinar live attendance. (source)
19. More than 68% will register for your virtual or hybrid event a week before the event date. (source)
20. Before the Covid-19 pandemic and lockdown, only 45% of people attended virtual events. Now, the number has grown to 87% due to the pandemic and its effects. (source)
21. For 46% of marketers, attendance is their greatest challenge regarding in-person events. (source)
22. The average number of attendees for virtual events is 1,356. This is more than the average number of 908 attendees for regular meetings. (source)
23. 68% of respondents said they were charging for virtual events and planned to continue, while 15% weren’t charging but planned to start the following year, and 10% had no plans to charge. (source)
24. 93.2% of people deemed their virtual event a success based on attendance. (source)
25. 77.2% of people prefer virtual events for their ease of attendance. (source)
Virtual Event Costs Statistics
26. 74% of event marketers do not charge for virtual event attendance. (source)
27. Hosting a small virtual event with about 10–100 people can cost $50–$250 monthly. However, large-scale events have between 500 and 2500+ attendees, costing between $625 and $8,000 per month. (source)
28. 33.7% of event marketers report that the average cost per virtual event attendee is between $500 to $1,000. (source)
29. The average sponsorship package for a virtual event costs $8,456. (source)
30. 87% of event planners try to use platforms that allow virtual booth sponsorship. (source)
31. About 32% of businesses cited pricing as the top challenge they face regarding hybrid events. (source)
32. The cost of hosting small virtual events (250 attendees or fewer) is between $3,000–$15,000. However, larger events can cost between $5,000–$30,000. (source)
33. Only 10% of virtual events are paid, as opposed to over 25% of hybrid or in-person events. (source)
34. 57.7% of businesses plan to increase their online events budget. 35.4% say they are not sure. (source)
35. 74% of B2B virtual event organizers need six months to see a positive ROI. (source)
Virtual Event Benchmarks, Challenges, And Success Statistics
36. Marketers are using their virtual event analytical data to adjust their marketing strategies with data-driven decision-making (42%), to understand the ROI of their events (30%), and to score new leads (15%). (source)
37. Marketers continue to struggle with measuring and utilizing data, with 41% citing it as a significant challenge, a concern that has increased by four percentage points since 2022. (source)
38. 74.9% of event planners switched from in-person events to virtual events due to COVID-19 in 2020. A report revealed that 47% of event planners canceled their events, 39.8% postponed their events, and 74.9% moved to virtual events due to COVID-19 in 2020. (source)
39. The average promotion time for a virtual event is 56 days. (source)
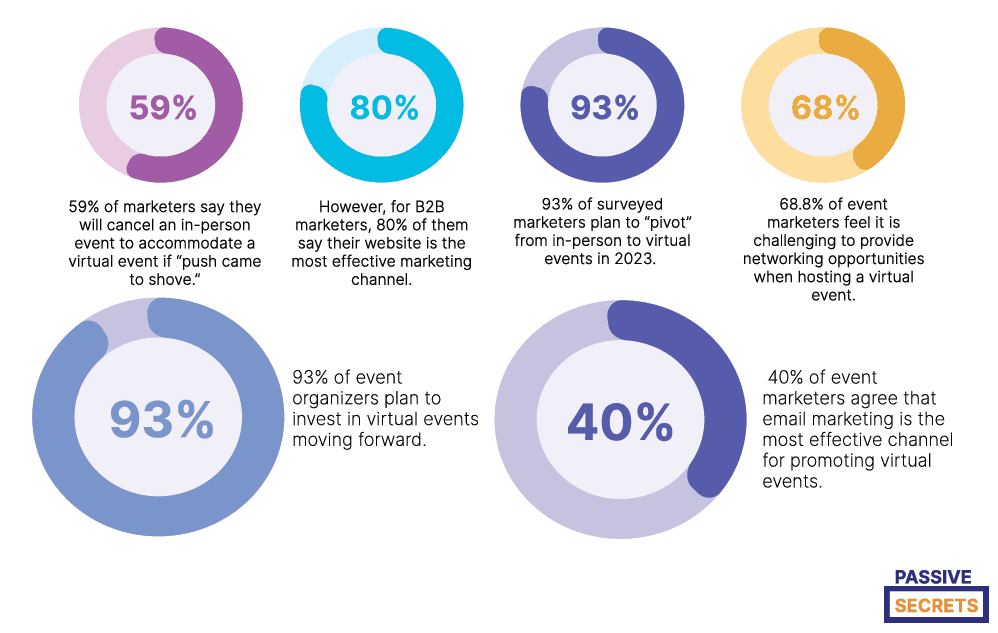
40. 93% of event organizers plan to invest in virtual events moving forward. (source).
41. 40% of event marketers agree that email marketing is the most effective channel for promoting virtual events. (source)
42. Virtual events had a 41% engagement level in Spain and also a 41% sales lead created. (source)
43. 59% of marketers say they will cancel an in-person event to accommodate a virtual event if “push came to shove.” (source)
44. However, for B2B marketers, 80% of them say their website is the most effective marketing channel. (source)
45. There’s an average of 20 speakers in a virtual event. (source)
46. 93% of surveyed marketers plan to “pivot” from in-person to virtual events in 2023. (source)
Out of this percentage, only 30% have written down their plan.
47. 80% of people join virtual events for educational purposes. (source)
48. For most people, small virtual events need between 3-6 weeks to be successfully promoted. However, 65% of marketers say they need more than six weeks for large virtual events. (source)
49. A survey of U.S. and UK participants in large-scale virtual events found that 26% said product demos had the most impact on their buying decisions, followed by 19% for expert Q&As and 17% for keynotes. (source)
50. 87% of marketers consider the opportunities generated by virtual events as a success factor. (source)
51. According to surveyed organizers, the top 3 benefits of virtual events are more registrations, increased attendee engagement, and higher ROI. (source)
52. 68.8% of event marketers feel it is challenging to provide networking opportunities when hosting a virtual event. (source)
53. 71% of event organizers rank deals closed as a success factor. (source)
54. 85% of marketers consider attendee satisfaction as a success factor. (source)
55. 43% of marketers find replicating event formats on a virtual model challenging. (source)
56. 39.5% of event organizers consider it easy to find great speakers for virtual events. (source)
57. 28% of U.S. and UK marketers aimed to increase brand awareness, 21% focused on revenue from ticket sales, and 17% prioritized building new relationships in their virtual events. (source)
58. 18.9% of respondents said their goal for hosting online events was to boost brand awareness. (source)
59. 54% of event planners are focused on attendee experience rather than logistics. (source)
60. 38% of marketers say they face technical problems when hosting virtual events. (source)
61. 70% of event planners say good microphones are critical to a successful virtual event. (source)
62. 67% of businesses find it more beneficial to host hybrid events. (source)
63. 67.7% of event marketers find it difficult to keep attendees engaged. (source)
Virtual Event Engagement Statistics
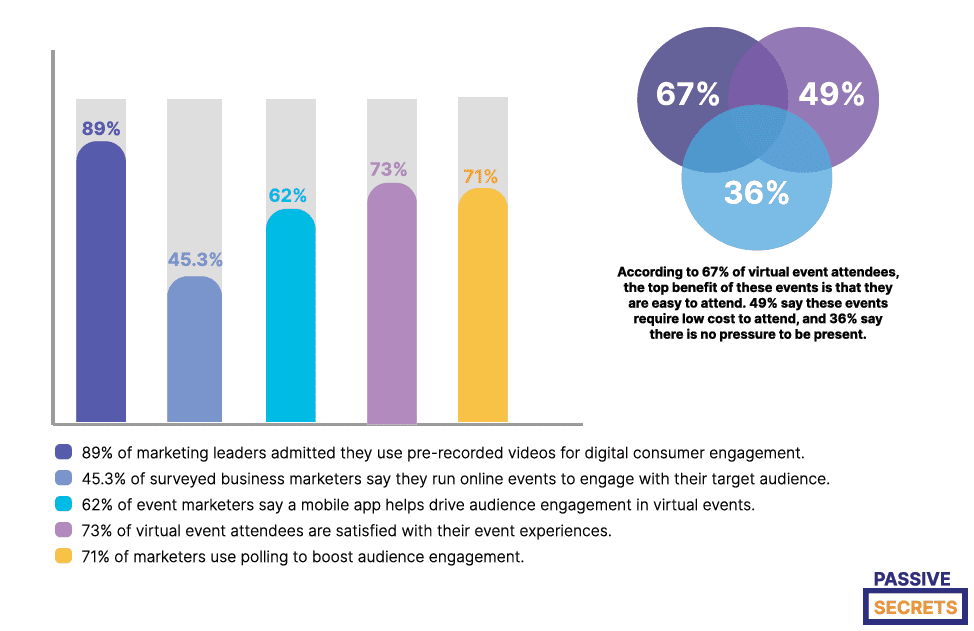
64. 89% of marketing leaders admitted they use pre-recorded videos for digital consumer engagement. (source)
65. Virtual events are 150% more likely unsuccessful if they lack attendee engagement. (source)
66. Nearly half (46%) of marketers agree that events and webinars are the most effective tools for generating awareness and interest in their products and services. (source)
67. 45.3% of surveyed business marketers say they run online events to engage with their target audience. (source)
68. 62% of event marketers say a mobile app helps drive audience engagement in virtual events. (source)
69. 73% of virtual event attendees are satisfied with their event experiences. (source)
70. Virtual events are a winning strategy for marketers, with 90% reporting increased attendance, 83% seeing a boost in brand awareness, and 77% achieving better lead generation results. (source)
71. 71% of marketers use polling to boost audience engagement. (source)
72. According to 67% of virtual event attendees, the top benefit of these events is that they are easy to attend. 49% say these events require low cost to attend, and 36% say there is no pressure to be present. (source)
73. Over 57% of B2B marketers prefer to attend the in-person version of a hybrid event than the virtual one. 33% said they liked the virtual version, while 10% had no preference. (source)
74. One in five U.S. marketers and exhibitors planned to increase spending on VIP events, 18% on user conferences, and none on virtual events. (source)
75. 95.5% of those surveyed confirmed that virtual events will be part of their event strategy for the next year. (source)
76. 96% of marketers see virtual events as a key driver for advancing DEI objectives. 38% of marketers value virtual events’ ability to offer DEI-friendly features like captions, sign language, and audio descriptions. (source)
77. 7.5% of respondents were solely interested in hosting virtual events. (source)
78. 28.4% of respondents preferred virtual events combined with some in-person elements. (source)
Virtual Event Software Statistics
79. The Global Virtual Event Platforms Market is poised for significant growth, reaching $9.9 billion in 2024 and expected to soar to $45.3 billion by 2034, with a remarkable 16.4% annual growth rate (CAGR) driving this expansion. (source)
80. Webinars are the most preferred/used virtual event format. 51% of surveyed virtual events visitors say they prefer webinars, while 43% say they prefer live meeting software. (source)
81. 50.3% of surveyed companies who run virtual events say they prefer using Zoom as a virtual event platform. 12% say they use Microsoft Team, while 9.4% use Facebook Live. (source)
82. According to 89% of marketers, webinars were more effective than other channels in generating qualified leads, while 78% said webinars helped lower their cost per lead. (source)
Virtual Event Fatigue Statistics
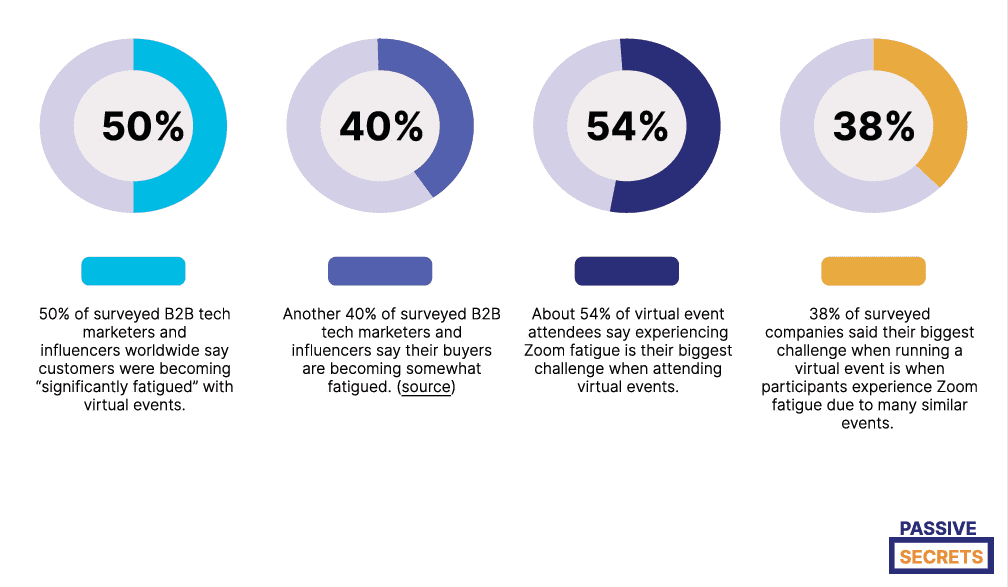
83. 50% of surveyed B2B tech marketers and influencers worldwide say customers were becoming “significantly fatigued” with virtual events. Another 40% say their buyers are becoming somewhat fatigued. (source)
84. According to experts, a typical virtual event should last 3–5 hours. Anything more than that can lead to more virtual fatigue. (source)
85. 38% of surveyed companies said their biggest challenge when running a virtual event is when participants experience Zoom fatigue due to many similar events. (source)
Hybrid Event Statistics
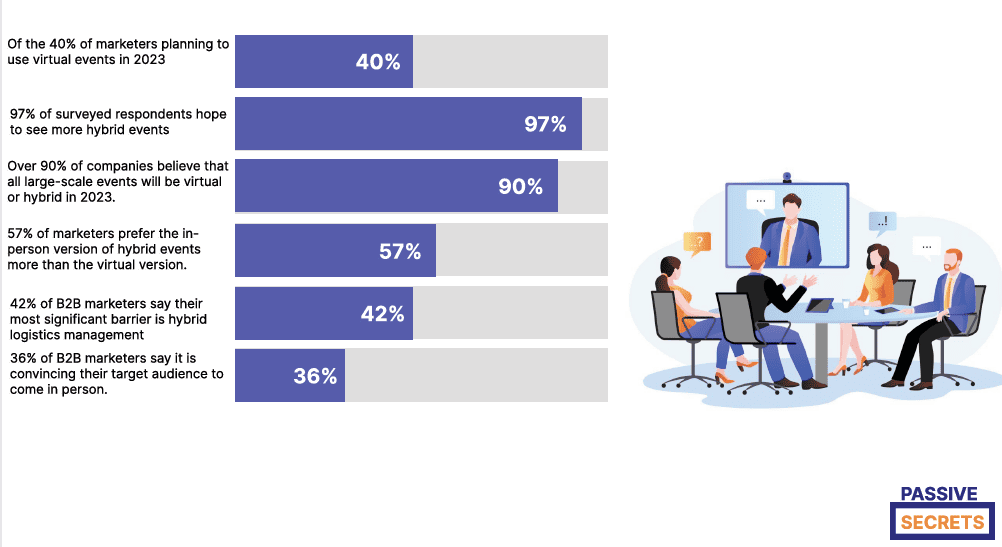
86. Of the 40% of marketers planning to use virtual events in 2023, 18% included hybrid events. (source)
87. Three-quarters (75%) of marketers find it simpler to develop content for virtual events compared to in-person events. (source)
88. 97% of surveyed respondents hope to see more hybrid events. (source)
79. Over 90% of companies believe that all large-scale events will be virtual or hybrid in 2023. (source)
90. 57% of marketers prefer the in-person version of hybrid events more than the virtual version. (source)
91. 57.4% of event organizers believe hybrid events will dominate the future. Next, 16.7% of respondents placed their confidence in virtual events, while 11.8% favored physical events. (source)
92. 49% of B2B marketers say their most significant obstacle to a successful hybrid event is making the physical and virtual experience equally good. 42% say their most significant barrier is hybrid logistics management, and another 36% say it is convincing their target audience to come in person. (source)
93. 43% of C-suite executives in Japan, the U.K., France, the U.S., and the Netherlands say they invest in hybrid experiences to offer more innovative, personalized products and services. 40% of the respondents say they do so to help their audience feel more connected. (source)
94. According to 8,227 marketers surveyed in 2021, 40% of their events were predicted to be virtual in 2022. In-person and hybrid events had 35% each. (source)
95. 20.9% of respondents expressed interest in hosting hybrid events, combining in-person and virtual elements. (source)
96. 38.8% of those surveyed believe hybrid events will be the most popular in 2024. (source)
97. 73.1% of event professionals planned to host at least one hybrid event in 2021, while 23.1% aimed to host more than five. (source)
98. 48.1% of survey respondents believe hybrid events will benefit their organization most. (source)
99. 41.5% of respondents said easy integration with the live show and other event applications is the most important requirement for a hybrid event platform. (source)
Challenges Associated with Hybrid Events
100. 75% of respondents said the biggest challenge at these events was connecting their in-person and virtual audiences. (source)
101. 62.3% of respondents identified content production as the second biggest challenge in executing hybrid events. (source)
102. 52.8% of respondents considered their event budgets a barrier to successful hybrid events. (source)
103. 41.5% of respondents cited planning logistics as a major hurdle to hybrid events. (source)
104. 34.8% of respondents said a lack of understanding of hybrid events results in an underwhelming experience. (source)
Final Thoughts On This Virtual Event Statistics
The statistics speak for themselves: virtual events have changed how we connect, collaborate, and do business with customers.
As the world becomes increasingly digital, including virtual events in your marketing strategy can give you a competitive edge and help you reach a wider audience.
Don’t miss out on the opportunity to upgrade your marketing strategy and tap into the power of virtual events. Explore the latest trends, insights, and numbers shaping the future of events and discover how virtual events can drive success for your business.

Other Marketing Statistics You Should Know:
- B2B Sales Statistics: Latest Insights and Trends
- 50+ Essential Traditional Marketing Statistics & Trends
- 60+ QR Code Statistics, Usage, Forecasts & Trends
- 90+ Useful Marketing Jobs Statistics & Facts (Latest Report)
- Sales Enablement Statistics: Data You Need to Drive Sales Growth
- In-store vs Online Shopping Statistics And Analysis
- Social Media Addiction Statistics
- Latest In-Game Advertising Statistics
- From Passion to Profit: 120+ Creator Economy Statistics
- 80+ Big Marketing Software Statistics
- 45 Interesting Healthcare Marketing Statistics & Trends
- Print Marketing Statistics: Ad Spending, Market Size, & More
- Key Short-Form Video Statistics and Trends You Should Know
- 49 Interesting Emotional Marketing Statistics
- 90 Amazing Millionaire Statistics
- 70+ Top Law Firm Marketing Statistics & NEW Trends
- Millennials on Social Media Statistics
- 23 Most Interesting First Impression Statistics To Know
- 60+ Interesting Storytelling Statistics, Facts & Huge Trends
- Amazon Book Sales Statistics: Intriguing Numbers and Facts
- 61+ Useful Podcast Advertising Statistics And Trends
- 50+ Useful Call Center Statistics And Trends
- 50 Crucial Amazon Advertising Statistics & Trends
- 65+ Must-Know Pay-Per-Click Statistics
- 40+ Interesting Omnichannel Marketing Statistics & Trends
- Multi-Level And Network Marketing Statistics, Facts & Trends
- 55 Interesting Direct Mail Marketing Statistics and Trends
- B2B Lead Generation Statistics, Facts, Trends, Benchmarks, & Market Size
- 52 Valuable Trade Show Statistics and Trends
- 100+ Top Digital Marketing Vs. Traditional Marketing Stats
- 110+ Important Social Media Advertising Statistics & Trends
- 50 Interesting Organic Vs. Paid Search Statistics To Know
- 41+ MOST Important Copywriting Statistics To Know
- 80+ Useful Sales Funnel Statistics & Conversion Rates
- 40+ Latest Multi-Channel Marketing Statistics & Huge Trends

