
Imagine pointing your phone at a small black-and-white square and instantly ordering your meal, making a payment, or unlocking exclusive content.
No apps to download. No typing. Just scan and go.
Just a few years ago, QR codes felt like a forgotten technology that nobody used. Today, they’re everywhere—on restaurant tables, product packaging, billboards, and payment terminals.
In 2019, only 11% of Americans had ever scanned one. By 2024? That number hit 89%. Till today, the number is still rising.
These tiny squares have become the bridge between physical and digital worlds, processing trillions in mobile payments and transforming how businesses connect with customers.
But just how big has this technology actually become? How many people scan QR codes daily? And which industries are driving the explosive growth?
This guide breaks down the numbers behind QR codes’ remarkable comeback and why they’re reshaping commerce, marketing, and digital experiences in 2026.
Key QR Code Statistics
- The global QR code market is projected to reach $13.04 billion by 2026, growing at a 17% CAGR, with over 2.2 billion active users worldwide.
- QR codes already power more than $3 trillion in payment transactions globally, showing their growing role in digital payments.
- 59% of consumers scan QR codes daily, while 90% have scanned at least once in the past month.
- Nearly 89 million Americans used their smartphones to scan QR codes, representing a 26% increase since 2020.
- QR code creation increased by 283% in 2022, while global scans grew by almost 60%, highlighting rapid adoption.
- 93% of marketers increased their QR code usage in the past year, with many significantly scaling their campaigns.
- 86% of marketers plan to increase QR code usage in 2026, indicating continued growth in marketing applications.
- 95% of businesses say QR codes help them collect valuable first-party customer data.
- In 2022, about 5.3 billion coupons were redeemed using QR codes, demonstrating their power in promotions and marketing.
- Global QR code payment spending is expected to exceed $3 trillion by 2025, up from $2.4 trillion in 2022.
General QR Code Statistics
1. The global QR code market is projected to hit $13.04 billion by 2026, growing at a 17% CAGR. With over 2.2 billion active users (29% of smartphone users), QR codes are driving over $3 trillion in payment transactions worldwide (QR Insights).
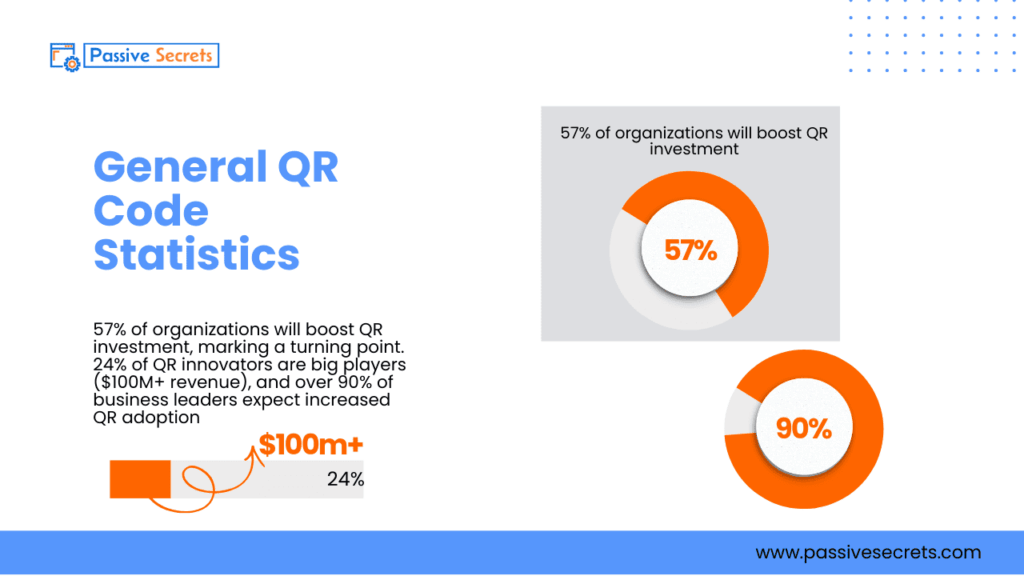
2. 57% of organizations will boost QR investment, marking a turning point. 24% of QR innovators are big players ($100M+ revenue), and over 90% of business leaders expect increased QR adoption (Uniqode).
3. QR code creation skyrocketed by 283% in 2022 compared to 2021 and increased by an additional 43% the previous year. While global QR code scans surged by nearly 60% in the same period (QR Code Kit).
4. A QR code can encode up to 2953 bytes, 4296 alphanumeric characters, 7089 numeric characters, or 1817 Kanji characters (JIS X 0208 character set) (Triton).
QR Code Usage Statistics
5. 59% of consumers scan QR codes daily, and a whopping 90% have scanned at least once in the past month. Young adults (18-29) are leading the charge, with 54% of this demographic likely to scan marketing QR codes in the US (QR Insights).
6. Also, nearly 89 million Americans used their smartphones to scan QR codes, a 26% increase from 2020 (Statista 2).
7. Global QR code usage statistics recorded 26.95 million scans in over 50 countries (QR Tiger).
8. Website QR codes are the most popular, accounting for 49% of all codes created in the past 12 months (QR Code Kit).
9. Major social media platforms use built-in QR codes to add friends by scanning unique codes (QR Tiger).
QR Code Marketing Statistics
10. Over half (55%) of marketers believe consumers’ limited understanding of QR codes hinders adoption, highlighting the need for marketers to better grasp the consumer experience to leverage this tech effectively (Bitly).
11. Marketers are moving beyond basic QR codes: 98% say customization is key, and 69% want the ability to frequently redirect links. Despite already high QR code adoption, 86% of marketers intend to boost usage in 2026 (Bitly).
12. While most marketers (50%+) focus on scan numbers and timing, QR codes offer a chance to gather valuable first-party post-scan data (Bitly).
13. QR codes have evolved to drive action and engagement, with around 50% of marketers using them for time-sensitive promotions and event registrations, transforming them into experience-driven tools (Bitly).
14. From niche to mainstream, QR codes are now a staple across industries, with near-universal adoption. The trend continues: 93% of marketers have upped their QR code usage in the past year, with over half scaling up significantly (Bitly).
15. About 88% of marketers say consumers are more open to QR codes, with 40% seeing a significant shift in the past 12 months. This means that audiences are scanning, and marketers are paying attention (Bitly).
16. 37% of marketers leverage QR codes for video demos or tutorials, targeting prospects in the consideration phase. Another 33% use them to boost loyalty program signups, capitalizing on moments that drive repeat business (Bitly).
17. Over half (51%) of marketers use QR codes for promotional offers and coupons, driving engagement and conversions. Another 49% leverage them for event awareness and registrations, making RSVPs a breeze (Bitly).
18. 45% of marketers use QR Codes to provide product details and specs, and 26% link to company social media pages. Top-performing QR Code campaigns often leverage exclusivity and urgency – 39% say exclusive content drives scans, while 33% point to discounts and promotions (Bitly).
19. 95% of businesses say QR codes help gather valuable first-party data, with 49% collecting data from over 10,000 customer interactions (Uniqode).
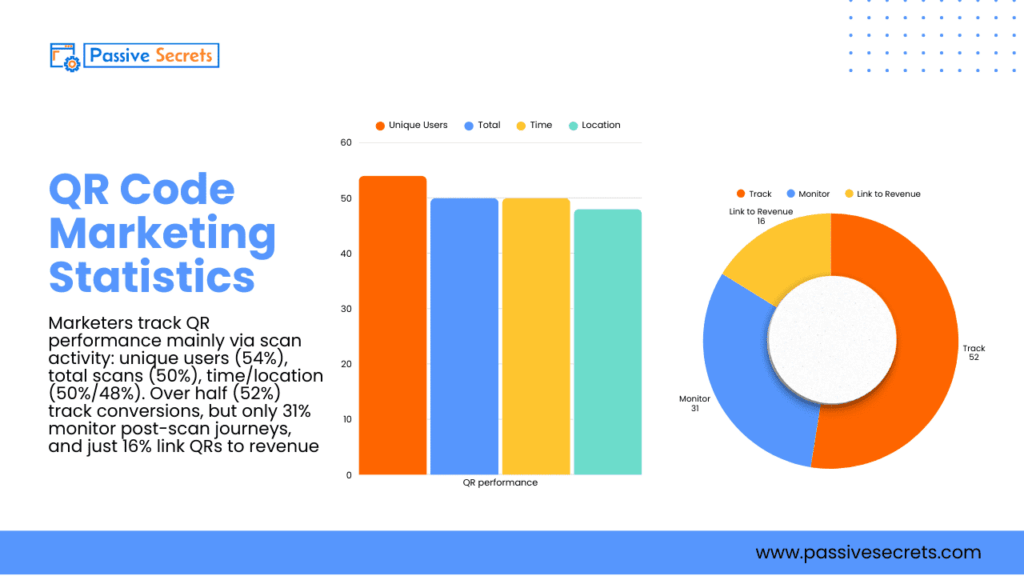
20.cMarketers track QR performance mainly via scan activity: unique users (54%), total scans (50%), time/location (50%/48%). Over half (52%) track conversions, but only 31% monitor post-scan journeys, and just 16% link QRs to revenue (Bitly).
21. In 2022, an estimated 5.3 billion coupon codes were redeemed via QR codes (Juniper Research).
QR Code Payment Statistics
22. In Japan, QR code payment app usage was most popular among 16- to 19-year-olds, with around 83% adoption. Meanwhile, the overall number of monthly active QR code payment users has been steadily rising in recent years (Statista).
23. A 2025 survey found that around 56% of respondents in Japan used PayPay, the leading QR code payment service, followed by Rakuten Pay at 27% (Statista).
24. The global QR code payment market is expected to grow from $18.6 billion in 2026 to $85.6 billion by 2036, at a 16.5% CAGR. This growth is driven by the rise of digital payments, mobile wallets, and cashless transactions, particularly in emerging markets (Future Market Insights).
25. The global QR Code Payment market is expected to surge from $18.6 billion in 2026 to $85.6 billion by 2036, with a 16.50% CAGR, driven by the rising demand for digital payments and QR codes’ simplicity and security (Future Market Insights).
26. In 2022, China had about 10 billion mobile devices that used QR codes for payments, making it the country with the most QR code usage (Statista 1).
27. QR code payments in Japan have grown, reaching nearly 15 trillion yen in transaction value (Statista).
28. A Juniper Research study predicted global QR code payment spending will reach over $3 trillion by 2025, up from $2.4 trillion in 2022 (Juniper Research).
QR Code Statistics by Industry
29. The US tops QR code adoption with 42.2% of global scans. Marketing and advertising drive 40% of usage, and 95% of businesses collect valuable first-party data through QR codes (QR Insights).
30. According to Peabody, Mezze and all Boqueria restaurants replaced menus with QR codes during the pandemic (CNBC).
QR Code Usage By Region
31. 1 in 5 European consumers were unsure about using QR codes more in the future (YouGov).
32. About half of Italians and Spaniards plan to use QR codes more frequently, unlike Germans and the French, who are more skeptical (YouGov).
33. Most consumers (two-thirds) find QR codes easy to use, with a clear majority in most markets (except Denmark and the US, where50% and 44% agree, respectively), considering them a simple way to access information (YouGov).
34. In Spain, 60% of consumers report using QR codes more frequently than before, while 25% say they are not using them more often (YouGov).
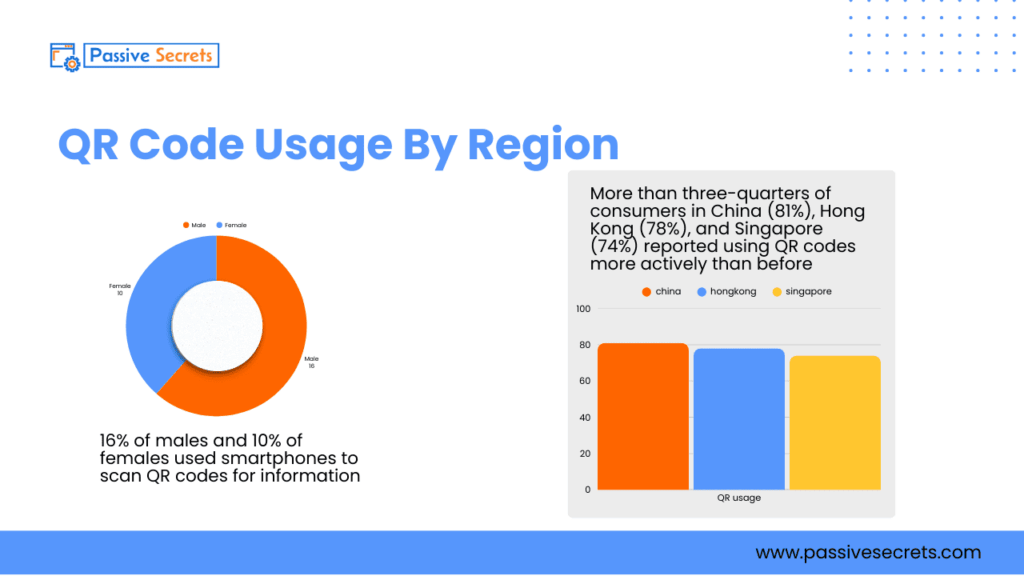
35. More than three-quarters of consumers in China (81%), Hong Kong (78%), and Singapore (74%) reported using QR codes more actively than before (YouGov).
36. The number of U.S. consumers scanning QR codes with their smartphones is expected to grow by 16 million from 2022 to 2025 (Statista).
37.40% of the Indian population is familiar with and uses QR codes (LinkedIn).
38. UPI QR codes grew by 79%, reaching 272 million as of June 2023 (Scanova).
39. In India, the transaction value of QR code payments is expected to rise from $62 billion in 2022 to $125 billion in 2026. This is driven by a national QR code standard and reduced cash usage (Juniper Research).
40. More than half of Mexicans reported using QR codes more actively, while about a quarter did not. Mexico led North American markets, with most planning to use QR codes more frequently (YouGov).
41. 16% of males and 10% of females used smartphones to scan QR codes for information (QR Tiger).
42. In 2020, MobileAssist, a Bahamian financial technology firm, teamed with Super Value to allow customers to pay for groceries with QR codes (QR Tiger).
43. QR code usage in the Bahamas is growing, with over 90,000 downloads and 7,500 registered users of MobileAssist’s app (QR Tiger).
44. The Central Bank of the Bahamas introduced a digital Bahamian dollar using QR codes for payments and fund transfers (QR Tiger).
45. AML Foods partnered with Kanoo to introduce QR code payments in their stores (QR Tiger).
46. Inbound travel to the Bahamas is streamlined with QR codes (QR Tiger).
47. In 2019, Japan introduced a standardized QR code, JPQR, for all participating payment providers (Statista).
48. Foreign students accepted to study in the Bahamas receive a special QR code to show upon arrival (Forbes).
QR Code Security Statistics
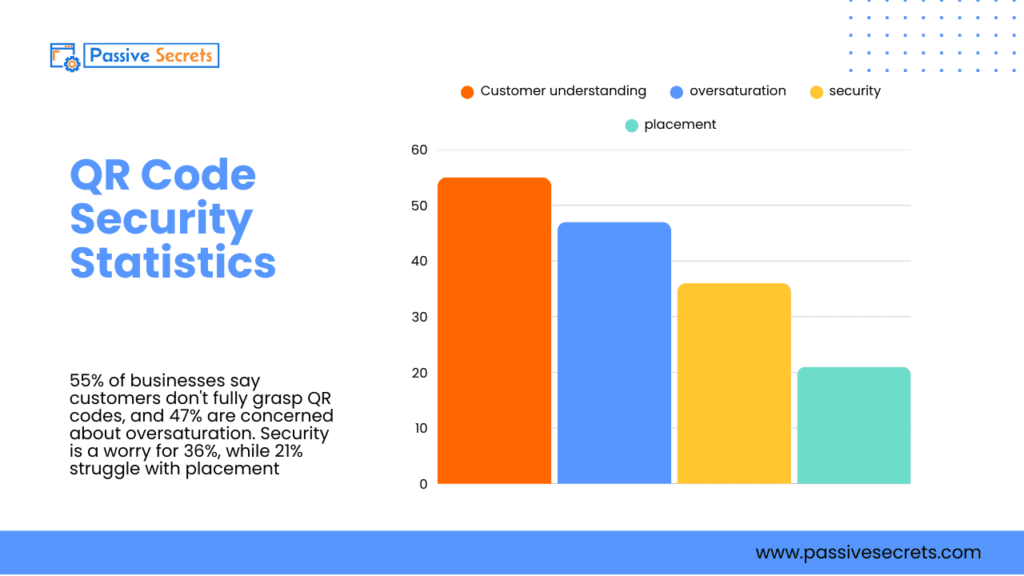
49. 55% of businesses say customers don’t fully grasp QR codes, and 47% are concerned about oversaturation. Security is a worry for 36%, while 21% struggle with placement (QR Insights).
50. Like barcodes, QR codes are designed with data redundancy, allowing data recovery even if up to 30% of the code is damaged (Fast Company).
Conclusion
QR codes have dramatically transformed how we interact digitally, and their adoption has surged across various industries.
From elevating marketing strategies to simplifying consumer experiences, QR codes revolutionize how businesses connect with their audience.
The QR code statistics vividly show a global trend towards embracing this technology, highlighting its convenience and versatility.
As businesses adapt to a digital-first world, the widespread adoption of QR codes signifies a shift towards more efficient and contactless interactions.
With an expected surge in usage and market value, QR codes are poised to become an integral part of our daily lives, seamlessly bridging the gap between the physical and digital realms.
FAQS
Other Statistics Posts You Should Know:
- Fiverr Statistics: Can You Still Make Money?
- 70+ Interesting Upwork Statistics & Key Facts
- 100+ Animation Statistics: The Ultimate Guide To The Industry’s Trends and Insights
- Shocking Social Media Addiction Statistics You Should Know
- 80+ Alarming Technology Addiction Statistics You Must Know
- Spotify Statistics: Latest Report on The Music Streaming Platform
- 50+ Useful Video Game Addiction Statistics, Facts & Huge Trends
- 50+ Vital Internet Safety Statistics & Facts You Must Know
- Internet Dangers Statistics: A Look At The Internet’s Dark Side
- The Future of Learning: 50+ Top EdTech Statistics
- The Web3 Statistics Report: Trends, Insights, and Predictions

