Unlock the secrets of successful pay-per-click advertising with the latest PPC statistics!
Pay-per-click advertising is constantly evolving and understanding the latest trends and benchmarks is crucial for success.
In this article, we’ll explore the most up-to-date PPC statistics, covering everything from Google Ads to social media PPC. These insights will help you optimize your campaigns and maximize your return on investment.
Let’s get started!
Key PPC Statistics (Editor’s Pick)
General PPC Statistics
1. 72% of online advertising professionals picked efficient growth as their most likely PPC ad goal for 2024. (source)
2. 50% of specialists think managing PPC campaigns is harder than two years ago, 16% think it’s easier, and 35% think it’s the same. (source)
3. 49% of practitioners say managing PPC is harder due to the loss of insights and data from automated campaigns (like Pmax). (source)
4. Trust in ad platforms has declined, with LinkedIn being the only exception. Google (54%), Twitter (51%), and Meta (42%) have significant trust deficits, largely due to issues like automation, reputation damage, unwanted content, and unreliability. (source)
5. Most PPC advertising budgets are increasing, with 12 out of 23 campaign types expecting a rise, especially on Google Ads and Meta. (source)
6. The PPC software market is expected to expand from $18.9 billion in 2023 to $20.96 billion in 2024, representing a 10.9% growth rate, and further increase to $32.22 billion by 2028 with an 11.4% annual growth rate. (source)
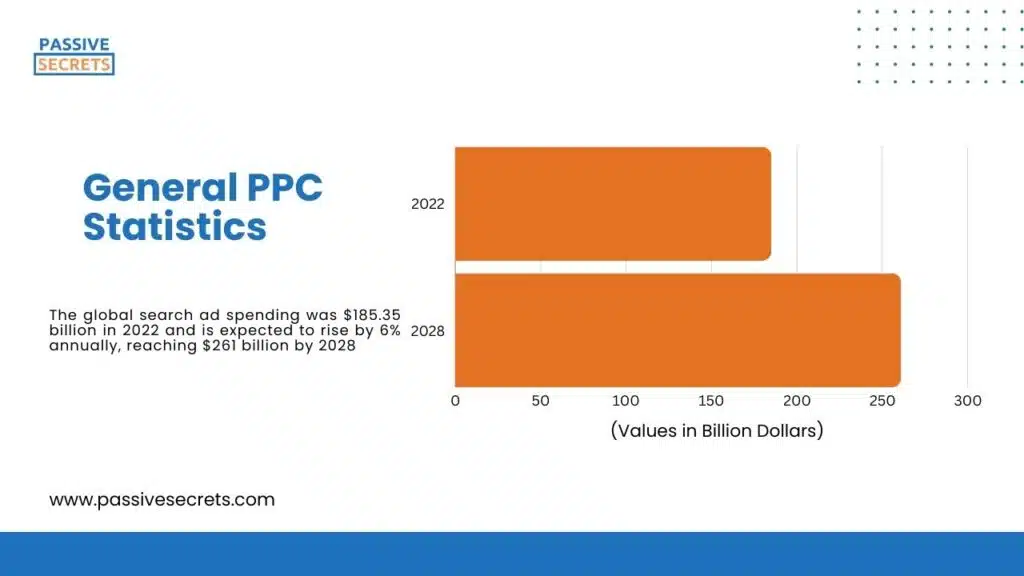
7. The global search ad spending was $185.35 billion in 2022 and is expected to rise by 6% annually, reaching $261 billion by 2028. (source)
8. 60% of US adults believed online search engines increased sponsored results, while 5% thought they decreased. (source)
9. 25% of US adults found distinguishing between sponsored and non-sponsored search results difficult, while 62% found it easy. (source)
10. In 2024, the average ad spending per internet user in the U.S. is projected to be $416.9. (source)
11. In the first half of 2023, Apple Search Ads saw an average tap-through rate (TTR) of 10.22% for search results, a slight increase from the 9.93% TTR in the second half of 2022. (source)
12. In 2023, the average conversion rate (CR) for Apple Search Ads rose to 65.37%, a slight increase from 65.10% in 2022. (source)
13. For the average conversion rate (CR) for Apple Search Ads, Entertainment led with a conversion rate of 79.88%. Despite industry challenges, food & Drink followed with 75.38%, with a projected market growth from $69.77 billion in 2023 to $180.77 billion by 2028. Photo & Video and Lifestyle trailed closely with 69.61% and 69.57%, respectively. (source)
14. In 2023, the average cost per tap (CPT) for Apple search ads decreased to $1.59, down from $1.99 in the second half of 2022. (source)
15. The Finance sector had the highest cost per tap (CPT) at $4.77, a decrease from $6.54 in the second half of 2022. (source)
16. The average cost per acquisition (CPA) for Apple search ads dropped to $2.58 in 2023, down from $3.21 in the second half of 2022. The top 5 categories for cost per acquisition (CPA) were Finance ($8.57), News ($4.01), Sports ($3.73), Business ($2.93), and Education ($2.77). (source)
17. On average, pay-per-click (PPC) advertising generates a 200% return on investment (ROI), with businesses earning $2 for every $1 spent. (source)
Search Ad Statistics
18. The global cost-per-click (CPC) for search advertising in the first quarter of 2024 was $0.62, representing a 19% increase from that of 2023, which stood at $0.52. (source)
19. Global search ad CTR rose to 1.6% in Q1 2024, up from 1.55% in Q1 2023, indicating a slight improvement in ad effectiveness. (source)
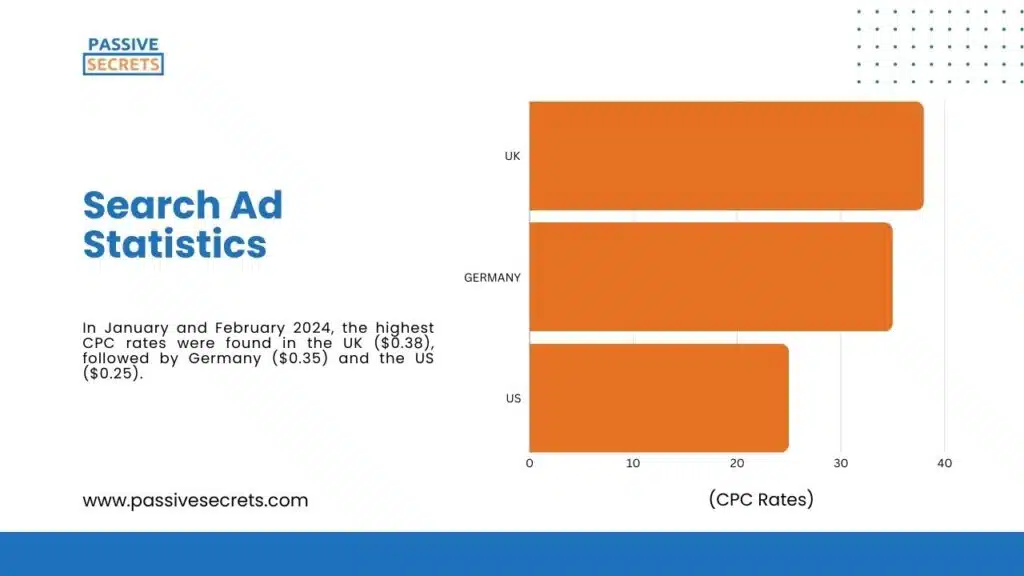
20. In January and February 2024, the highest CPC rates were found in the UK ($0.38), followed by Germany ($0.35) and the US ($0.25). (source)
21. The average search advertising CPC for attorneys and legal services was the highest at $8.94, while arts and entertainment had the lowest at $1.72, based on data from April 2023 to March 2024. (source)
22. In 2023, search advertising accounted for 40% of US online ad revenue, while digital static display ads made up around 33%. (source)
23. Global search advertising is projected to reach $330 billion in 2024, split between retail media ($126 billion) and traditional search ($204 billion). (source)
24. 91% of US paid search marketers believe chat-based search ads will be effective, while 9% are skeptical, thinking they won’t be effective at all. (source)
25. Global search advertising spending is projected to reach $306.7 billion in 2024 and grow at an annual rate of 8.01% from 2024 to 2028, reaching $417.4 billion by 2028. (source)
26. UK search advertising spending is expected to reach $23.3 billion in 2024 and grow at an annual rate of 7.53% from 2024 to 2028, reaching $31.2 billion by 2028. (source)
27. The U.S. search advertising spending is projected to reach $132.0 billion in 2024 and grow at an annual rate of 9.33% from 2024 to 2028, reaching $188.6 billion by 2028. (source)
28. In 2023, search advertising revenue in the US reached an all-time high of $88.8 billion, maintaining its position as the largest segment of digital ad spending, with a 5.2% increase from the previous year. (source)
29. The global ad spending market is projected to grow by $331.5 billion at a compound annual growth rate (CAGR) of 8.51% between 2023 and 2028. (source)
30. US restaurant search ad conversions dropped by 59% and impressions fell by18% between February 24 – Mar 25, 2020, amid the COVID-19 outbreak. (source)
31. From April 2023 to March 2024, the arts and entertainment industry had the highest average search ad CTR in the U.S at 13.04%, while attorneys and legal services had the lowest at 5.3%. (source)
32. From April 2023 to March 2024, the automotive industry (repair, service, and parts) had the highest search ad conversion rate at 12.96%, while furniture had the lowest at 2.53%. (source)
33. The overall click-through rate on Bing averages 2.83% across all industries. (source)
34. The overall average cost per click on Bing is $1.54 across all industries. Bing’s average cost per click (CPC) is 33% lower compared to Google Ads. (source)
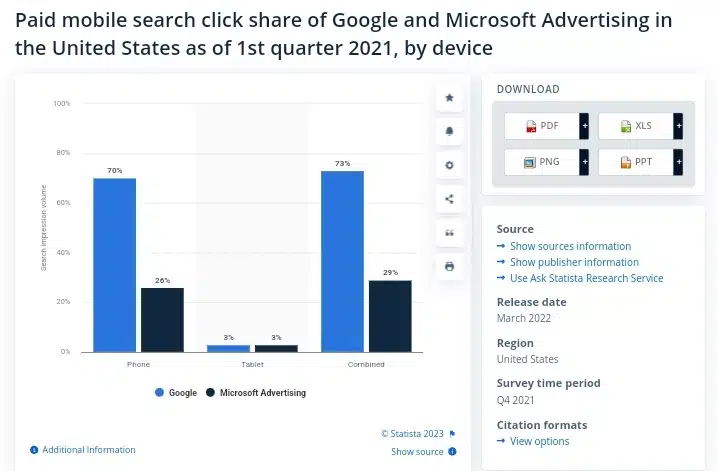
35. The overall conversion rate on Bing averages 2.94% across all industries. (source)
36. The overall average cost per acquisition (CPA) on Bing is $41.44, which is approximately 30% lower than the average CPA on Google AdWords. (source)
Google PPC Statistics
37. PPC specialists from South & Southeast Asia and advertisers hiring an agency trust Google Ads more than average, with 41% and 35%, respectively, saying their trust increased, compared to the 16% average. (source)
38. 63% of experts plan to increase budget allocation to Google’s Performance Max campaigns. (source)
39. Google’s 2023 global ad revenue was $237.86 billion, generated through Google Ads, which displays ads across Google’s ad network. (source)
40. Google removed 5.2 billion violating ads in 2022, which has consistently risen over the past five years. (source)
41. Google is projected to lead global online ad revenue in 2024 with $190.5 billion, followed by Meta with $146.3 billion and Amazon with $52.7 billion. (source)
42. In 2024, Google Ads typically experience a click-through rate of around 6.42%, meaning that approximately 6-7 people out of every 100 who see an ad will actually click on it. (source)
43. This year, the top-performing industries for Google Ads click-through rates were:
On the other hand, the industries that struggled the most with CTRs were:
44. Google Ads’ cost per click (CPC) averages $4.66 in 2024. (source)
45. In 2024, the industries with the most affordable Google Ads costs per click (CPC) were:
On the other hand, the industries with the highest CPCs were:
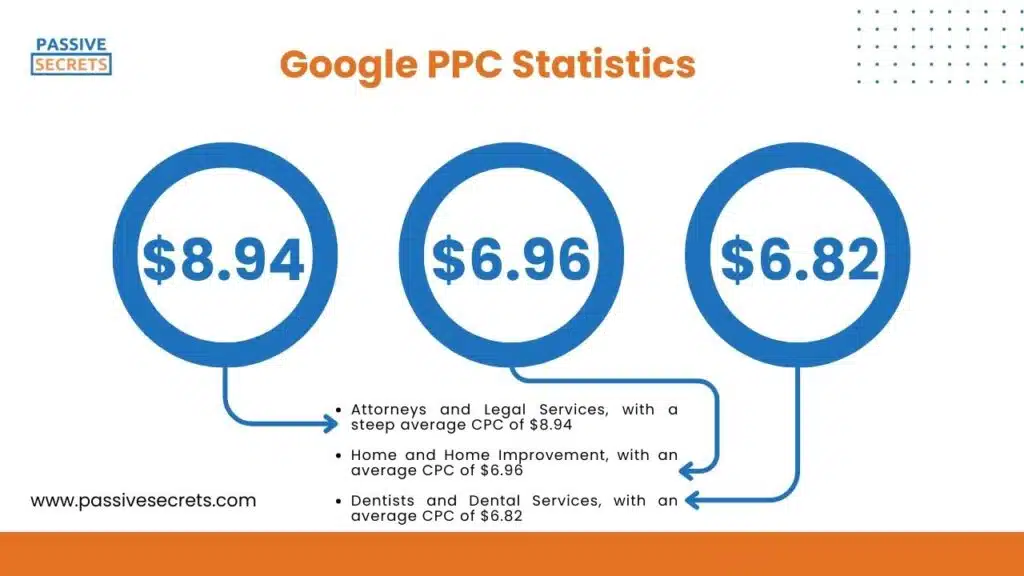
46. Google Ads conversion rate averages 6.96% in 2024, meaning about 7 in 100 clicks lead to a conversion. (source)
47. The average Google Ads cost per lead in 2024 is $66.69. (source)
48. The UK had the highest Google Ads search CPC at $1.22, while Albania had the highest in Central and Eastern Europe at $0.65. (source)
49. In Brazil, the marketing and advertising industry had the highest Google Ads CPC in May 2023 at $4.22, followed by the internet and telecom industry at $1.66. (source)
50. Google search ad spend rose 17% year-over-year in Q1 2024, unchanged from Q4 2023. However, growth drivers are shifting: CPC growth accelerated to 13% year-over-year (up from 9% in Q4), while click growth slowed. (source)
51. In Q1 2024, an average of 89% of Google shopping advertisers used Performance Max (PMax) campaigns, slightly down from 91% in Q4 2023 but up from 82% in Q1 2023. (source)
52. Google text search ad spend grew 15% year-over-year in Q1 2024, a slight decrease from 16% growth in Q4 2023. Text ad clicks increased 1%, while CPC growth slowed to 14% year-over-year, down from 16% in Q4. (source)
53. Retail brands running Google search ads have seen a 40-50% increase in average CPC over the past five years, with the median advertiser’s CPC rising 20% in the past year alone (from Q1 2023 to Q1 2024). (source)
54. In May 2023, Israel had the highest Google Ads search advertising cost-per-click (CPC) rate, averaging $1.08 per click. The UAE and Kuwait followed closely behind, ranking second and third, respectively, among 14 countries researched in MENA. (source)
55. Google Ads’ average CTR is 3.17% for search ads and 0.46% for display ads. (source)
56. Google Ads’ average CPC is $2.69 for search ads and $0.63 for display ads. (source)
57. Google Ads’ average conversion rate is 3.75% for search ads and 0.77% for display ads. (source)
58. Google Ads’ average cost per acquisition (CPA) is $48.96 for search ads and $75.51 for display ads. (source)
59. Around May 2023, the US marketing and advertising industry had the highest Google Ads search CPC at $6.56 and for France, it was $1.33. (source)
60. Google Ads usage in France remained steady at 45% from 2017 to 2021, despite efforts to blend paid ads with organic results. (source)
61. In May 2023, Brazil’s Google Ads search advertising CPC averaged $4.22 in the marketing and advertising industry, followed by the internet and telecom industry at $1.66. (source)
62. In 2022, Adobe Inc. topped the list of SaaS companies in global Google Ads spending, investing approximately $130 million, followed by IBM at $85.7 million and WordStream Inc. at $80.4 million. (source)
63. In May 2023, the UK had the highest average monthly Google Ads search CPC at $1.22, while Albania had the highest CPC in Central and Eastern Europe at $0.65. (source)
64. In Google Ads search advertising, the average monthly CPCs were: South Africa ($0.51), Egypt ($0.72), and Nigeria ($0.66). (source)
Social Media PPC Statistics
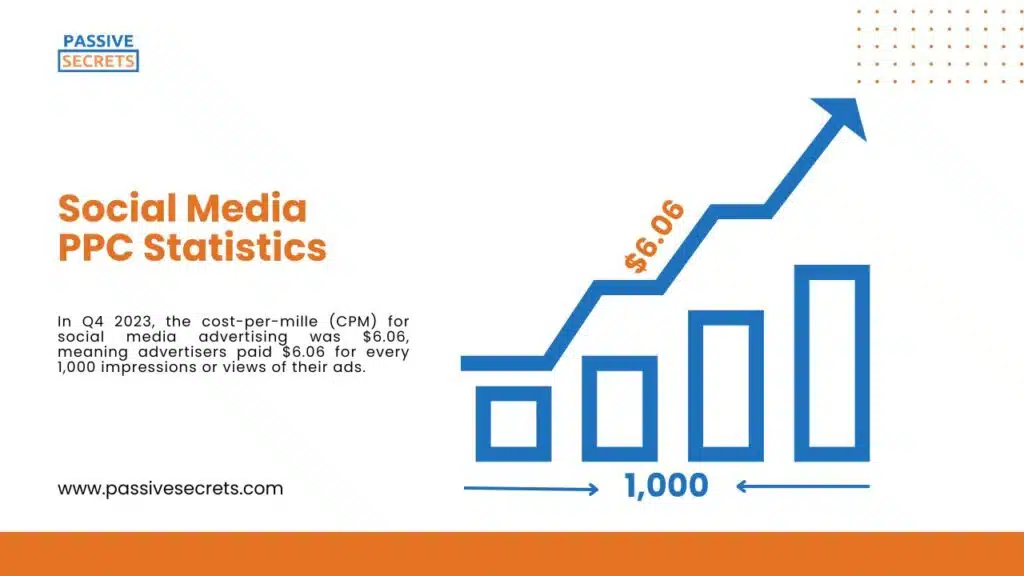
65. In Q4 2023, the cost-per-mille (CPM) for social media advertising was $6.06, meaning advertisers paid $6.06 for every 1,000 impressions or views of their ads. (source)
66. In March 2023, the technology industry had the highest CPM (cost-per-mille) for Facebook ads worldwide, at $9.98, while manufacturing products and services had the lowest CPM, at $2.40. (source)
67. In January 2024, the average cost-per-click (CPC) for ads on Meta platforms (Facebook, Instagram, Messenger) was €0.16, while the median cost per thousand impressions (CPM) was €0.11. (source)
68. Reel ads accounted for 17% of Facebook impressions in Q1 2024, up from 3% in Q1 2023. On Instagram, Reel ads accounted for 13% of impressions in Q1 2024. (source)
69. YouTube ad spending grew 18% year over year in Q1 2024, with TV screens accounting for 30% of investment, a 36% year-over-year increase. (source)
70. Meta advertising spend increased 16% year over year in Q1 2024, the third consecutive quarter of double-digit growth. CPM was flat year over year, and impressions rose 15%. (source)
71. Facebook CPM decreased 2% year-over-year in Q1 2024, the smallest drop in 7 quarters. Impressions growth slowed to 11%, but spend growth accelerated due to a smaller decrease in ad impression costs. (source)
72. Instagram CPM increased 6% year-over-year in Q1 in 2024, the second consecutive quarter of growth. Impressions and spend growth accelerated, with spend rising 34% (the fastest rate since Q4 2021). New inventory from Reels and Explore is driving growth, while Feed and Stories impression share hit an all-time low. (source)
73. Instagram’s share of Meta ad spend increased from 27% to 30% in Q1 2024, while Facebook’s share decreased from 72% to 69%. (source)
74. YouTube ad spend rose 18% year-over-year in Q1 2024, an increase from 17% growth in Q4 2023. Although impression growth slowed to 21% (from 25% in Q4), ad pricing trends strengthened. (source)
75. The average click-through rate in Facebook ads for traffic campaigns across all industries is 1.57%. (source)
76. The Facebook ads with the highest click-through rate by industry are Real Estate (2.60%), Arts and Entertainment (2.59%), and Travel (2.20%). However, those with the lowest click-through rates are Finance and Insurance (0.88%), and Dentists and Dental Services (0.99%). (source)
77. The average cost per click (CPC) for Facebook ads across all industries is $0.77. (source)
78. The industries with the highest CPCs are Attorney and Legal Services ($1.09), Apparel Fashion and Jewelry ($1.07), Dentists and Dental Services ($1.07), and Furniture ($1.06). However, the lowest average CPCs are Travel ($0.42), Arts and Entertainment ($0.43), and Restaurants and Food ($0.72). (source)
79. The average click-through rate in Facebook ads for leads campaigns across all industries is 2.53%. (source)
Shopping PPC Statistics
80. Amazon’s ad sales revenue reached $46.9 billion in 2023, a 24% increase from the previous year, capturing 10.2% of global digital ad spending. (source)
81. Amazon Sponsored Products ad spending grew 17% year-over-year in Q1 2024, matching Google search and YouTube trends. Also, Sponsored Products accounted for 82% of Ad Console spend, while Amazon DSP spending increased 18% in Q1 2024, driven by the introduction of Prime Video ads. (source)
82. Amazon advertisers increased Sponsored Products spend by 17% year-over-year in Q1 2024, matching Q4 2023 growth. While CPC growth slowed to 11% (from 19%), click growth rebounded to 6% (from -2% in Q4 2023), the strongest increase since Q1 2023. (source)
83. Amazon has started integrating sponsored ads into Rufus, its generative AI chatbot launched earlier this year, as a new move to expand its advertising reach. (source)
Mobile PPC Statistics
84. Google dominated the US mobile search market in March 2024 with a 95% share. DuckDuckGo and Yahoo! followed with 1.84% and 1.54% shares, respectively. (source)
85. By 2028, mobile devices are expected to generate $251.1 billion in search advertising spending, accounting for a significant portion of the total market. (source)
86. By 2028, mobile devices are expected to generate $123.6 billion in search advertising spending in the U.S. (source)
87. The total mobile ad spend in 2023 was $362 billion. (source)
88. In 2024, US adults spent 31.7% of media time on mobile. As a result, mobile digital ad spend increased to 51.2% of total media ad spend, up from 5.9% in 2013. (source)
Display PPC Statistics
89. Over a third of advertisers plan to decrease spending on Google Display and Twitter ads, with Twitter potentially seeing significant budget cuts (23% expecting substantial decreases). (source)
Conclusion
PPC statistics are a powerful tool for any digital marketer looking to optimize their campaigns and drive results.
By understanding the latest trends and benchmarks, you can stay ahead of the competition and achieve success in the ever-changing world of PPC advertising.
Remember, knowledge is power – and with these PPC statistics at your fingertips, you’ll be well-equipped to take your campaigns to the next level.
Other Related Marketing Statistics You Have To Know:
- B2B Sales Statistics: Latest Insights and Trends
- 50+ Essential Traditional Marketing Statistics & Trends
- 60+ QR Code Statistics, Usage, Forecasts & Trends
- 90+ Useful Marketing Jobs Statistics & Facts (Latest Report)
- Sales Enablement Statistics: Data You Need to Drive Sales Growth
- In-store vs Online Shopping Statistics And Analysis
- Social Media Addiction Statistics
- Latest In-Game Advertising Statistics
- From Passion to Profit: 120+ Creator Economy Statistics
- 80+ Big Marketing Software Statistics
- 45 Interesting Healthcare Marketing Statistics & Trends
- Print Marketing Statistics: Ad Spending, Market Size, & More
- Key Short-Form Video Statistics and Trends You Should Know
- 49 Interesting Emotional Marketing Statistics
- 90 Amazing Millionaire Statistics
- 70+ Top Law Firm Marketing Statistics & NEW Trends
- Millennials on Social Media Statistics
- 23 Most Interesting First Impression Statistics To Know
- 60+ Interesting Storytelling Statistics, Facts & Huge Trends
- Amazon Book Sales Statistics: Intriguing Numbers and Facts
- 61+ Useful Podcast Advertising Statistics And Trends
- 50+ Useful Call Center Statistics And Trends
- 50 Crucial Amazon Advertising Statistics & Trends
- 40+ Interesting Omnichannel Marketing Statistics & Trends
- Multi-Level And Network Marketing Statistics, Facts & Trends
- Virtual Event Statistics & Benchmarks For Marketers & Organizers
- 55 Interesting Direct Mail Marketing Statistics and Trends
- B2B Lead Generation Statistics, Facts, Trends, Benchmarks, & Market Size
- 52 Valuable Trade Show Statistics and Trends
- 100+ Top Digital Marketing Vs. Traditional Marketing Stats
- 110+ Important Social Media Advertising Statistics & Trends
- 50 Interesting Organic Vs Paid Search Statistics To Know
- 41+ MOST Important Copywriting Statistics To Know
- 80+ Useful Sales Funnel Statistics & Conversion Rates
- 40+ Latest Multi-Channel Marketing Statistics & Huge Trends

