
A deep look into the latest call center statistics shows how much the industry is growing.
Call centers play a significant role in customer experience. In fact, most consumers prefer talking with a human call agent.
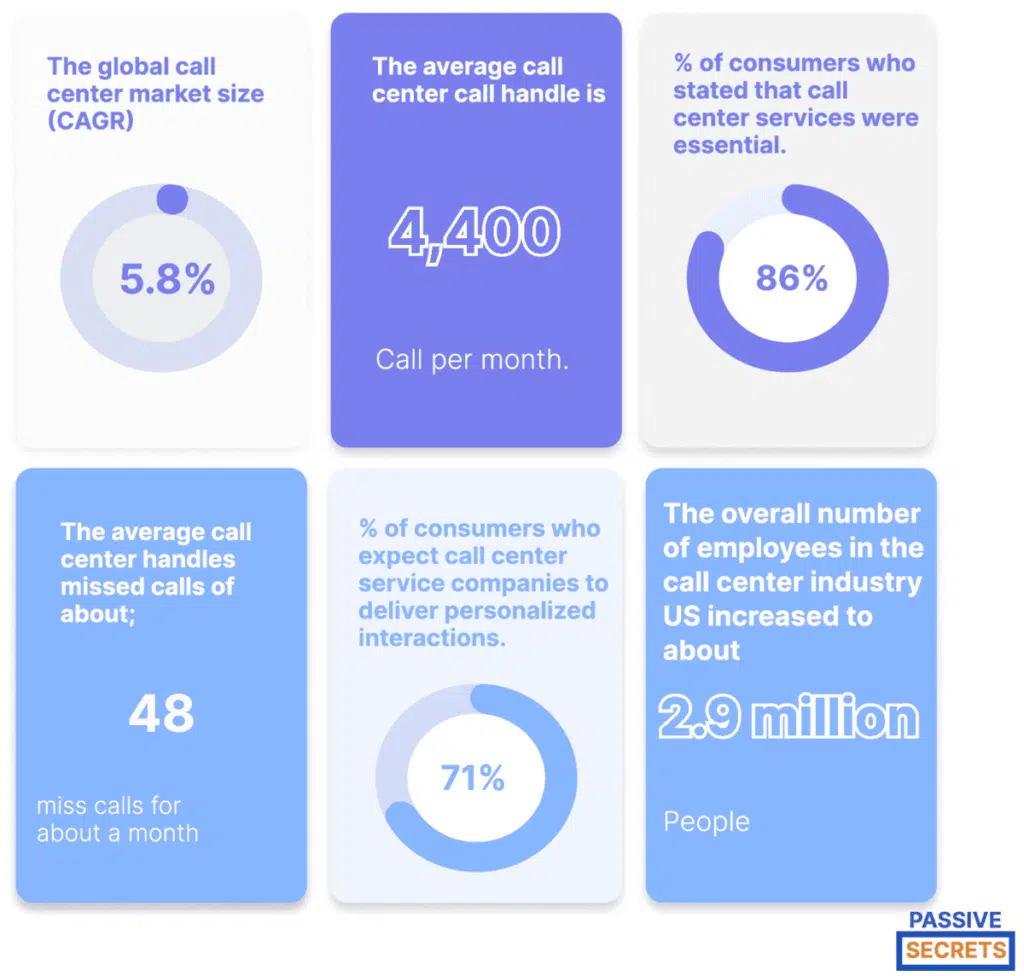
Hence, call centers receive an average of 4,400 calls monthly.
However, there is more to the call center industry. I have also gathered the latest call center statistics to give you deeper insights into the industry.
I also shared some exciting call center trends to look out for in 2024. These trends show you the latest happenings in the industry so you can update your business.
Let’s take a look.
Key Call Center Statistics
- The global call center market size is expected to grow at a CAGR of 5.8%, reaching $494.7 billion by 2030
- The overall number of employees working in the call center industry in the US increased to about 2.9 million people.
- 86% of consumers stated that call center services were essential.
- The call center AI market size is expected to be worth $2.8 billion by 2024.
- The average call center handles about 4,400 calls monthly, with around 48 missed calls.
- 71% of consumers expect call center service companies to deliver personalized interactions.
- In 2026, conversational AI will save $80 billion on labor costs for contact center agents.
General Call Center Statistics
1. The US has remained a global competitor in the call center industry regarding employment and expansion. (source)
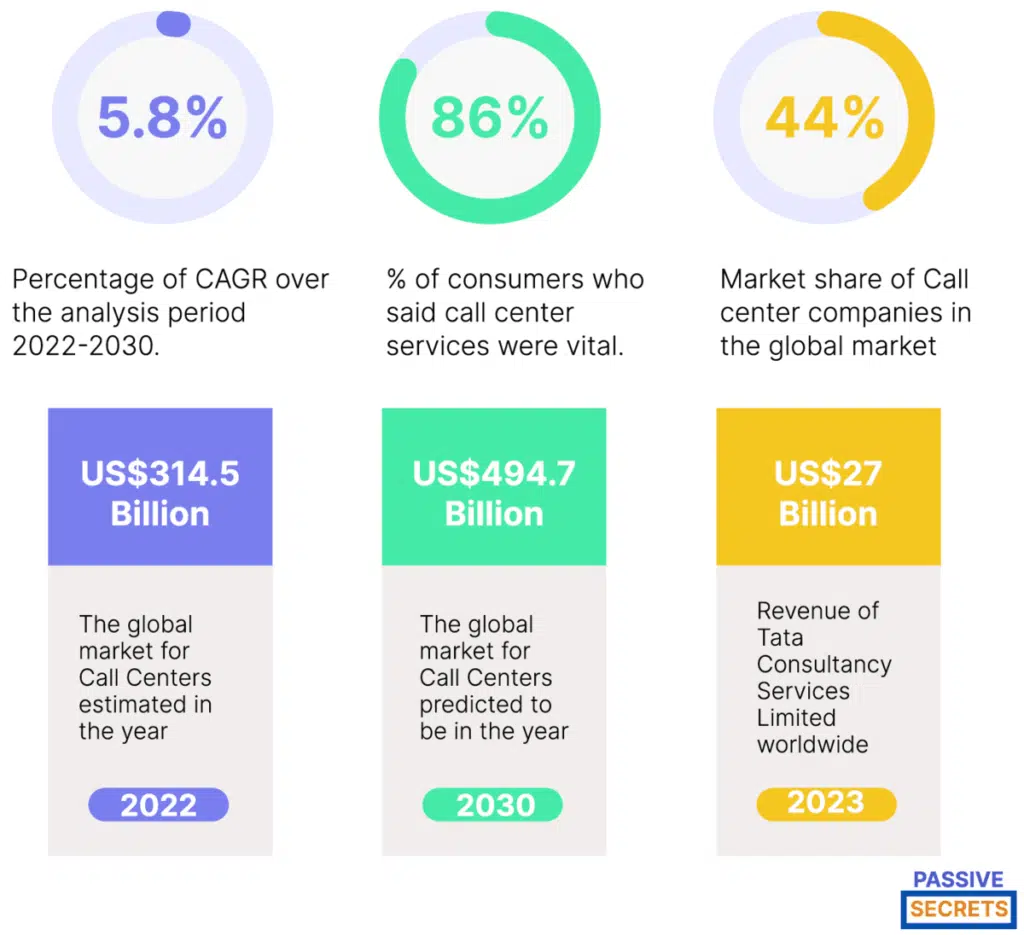
2. The global market size for call center services amounted to about $314.5 billion in 2022. This figure is expected to grow at a CAGR of 5.8%, reaching $494.7 billion by 2030. (source)
3. As of 2022, there were over 2.9 million employees in the U.S. call center industry. (source)
4. India-based Tata Consultancy Services is one of the leading call center services providers and has generated approximately $27 billion in revenue. (source)
5. Another major call center service provider is Genpact. Since 2006, the company’s revenue has increased annually, reaching around $4 billion in 2022. (source)
6. The number of jobs created in the call center industry in the U.S. significantly fell from almost 25,000 in 2016 to nearly 2,000 in 2022, a decrease of approximately 23,000. (source)
7. In 2022, call center service representatives at government agencies in the United States earned approximately $43,000 annually. (source)
8. In a 2022 survey, 86% of consumers said call center services were vital. This is because of the need to contact a real person when communicating with a business. About 4% of consumers claimed that it wasn’t necessary. (source)
9. In 2017, with an annual revenue of $500 million to $1 billion, call center service companies had the most prominent presence in the global call center software market, with a market share of 44%. (source)
10. The number of jobs created in the global call center industry between 2020 and 2022 fluctuated significantly. The industry with the highest amount of new jobs created totaled about 110,000 jobs. (source)
11. The average call center handles about 4,400 calls monthly, with around 48 missed calls. (source)
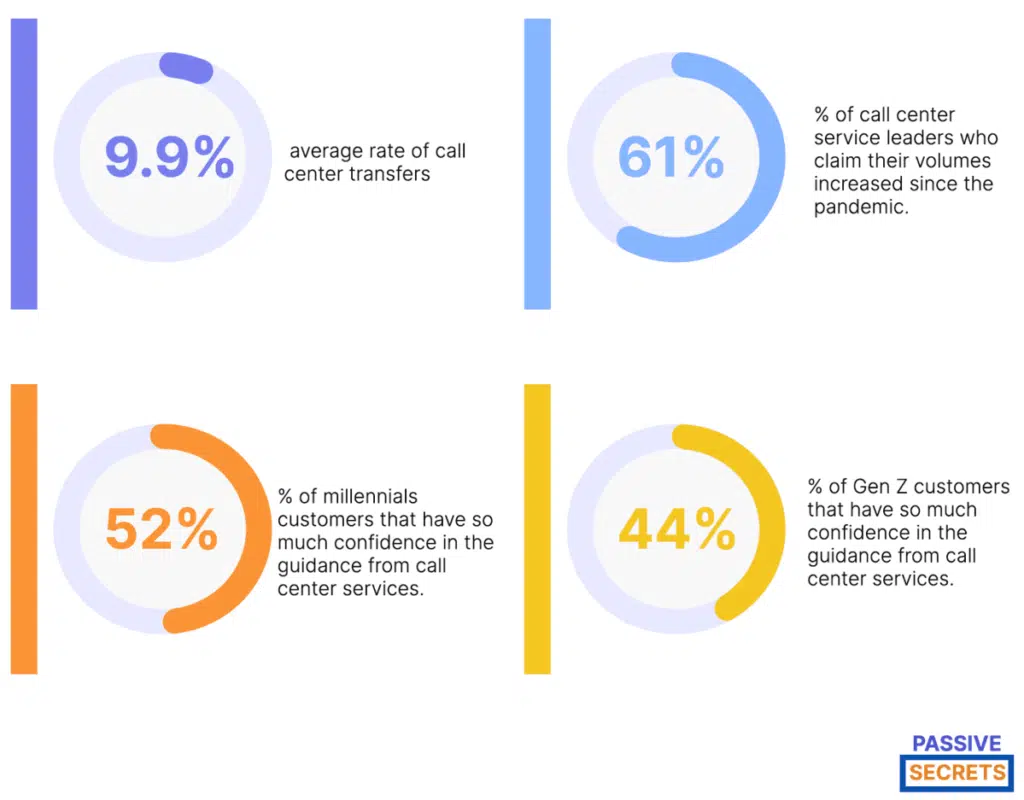
12. The average rate of call center transfers is 9.9%, with a typical caller being moved 2.6 times before their issue is resolved. (source)
13. Most consumers prefer talking on the phone to a human call center agent for both critical and non-critical matters. (source)
14. 61% of call center service leaders claim that their volumes have increased since the pandemic years of 2020 and 2021. This increase is despite the availability of self-service solutions for customers and AI-based tools like chatbots. (source)
15. AHT refers to Average Handling Time. It refers to the average duration of a customer call. It covers the entire call, including hold times, transfers, talk times, and after-call work. The typical call center benchmark for AHT is six minutes. (source)
16. The average call duration is 302 seconds. Also, the average call center hold time is 25.8 seconds. (source)
17. 52% of millennials and 44% of Gen Z customers have so much confidence in the guidance from call center services. (source)
18. 62% of millennials and 75% of Gen Z customers claim they would not contact a call center service even if needed. (source)
19. Out of 60 minutes, call center agents spend an average of 31.8 minutes talking to customers. Then, they spend 5.22 minutes idle, 10.2 minutes on post-call follow-up, and 15.96 minutes for meetings, training sessions, or breaks. However, most call centers ensure that agents are available to attend to callers for 54 minutes every hour. (source)
20. 71% of consumers expect call center service companies to deliver personalized interactions. 76% of these consumers get frustrated when they don’t get what they want. (source)
21. 58% of customers are willing to pay more to a brand for pleasant call center service. (source)
22. The average worldwide call center first contact resolution rate is between 70% and 75%. The first contact resolution rate refers to how often call queries are resolved at the first call. (source)
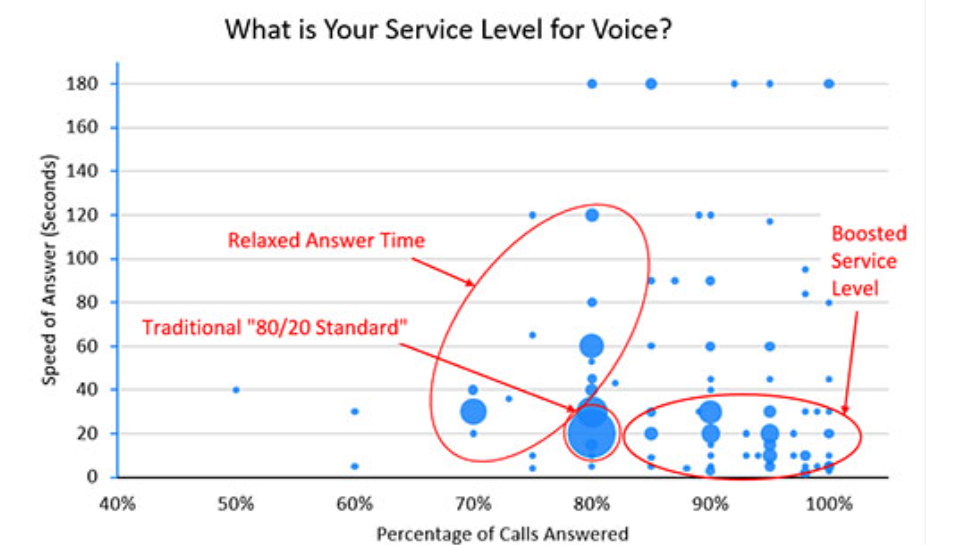
23. Call center services aim to answer 80% of calls in under 20 seconds, and efforts are being made to improve the numbers to 90% in under 15 seconds. (source)
24. The average cost per call center service for consumers observed across industries is $2.70 – $5.60. (source)
25. Over half of retail customers prefer support conversations over the phone, and 30% prefer text messaging. (source)
26. 31% of customers claim they expect a response rate when they reach out to a business call center in 24 hours or less. (source)
Call Center AI Statistics
27. The call center AI market size is expected to be worth $2.8 billion by 2024. (source)
28. The Global Call Center AI market was worth $1.38 billion in 2022. It is expected to grow at a CAGR of 23.1% between 2023 and 2030. (source)
29. The automation rate in call center service agent interactions will increase by 5× and reach approximately 10% by 2026, compared to 1.8% in 2022. (source)
30. Two-thirds of surveyed contact center managers believe AI will make agents’ jobs easier, increasing the number of agents in the next ten years. (source)
31. In 2026, conversational AI will save $80 billion on labor costs for contact center agents. (source)
32. According to Gartner, by 2026, one in 10 agent interactions will be automated by AI. (source)
Call Center Statistics for Better Services
33. 83% of executives face moderate to severe revenue and market share risks due to unimproved customer experience. (source)
34. Customers will pay up to a 16% price bonus just to have a better customer experience based on their purchase of products and services. These companies will also earn customer loyalty. (source)
35. 95% of call center professionals say that customer satisfaction is the most critical call center metrics. This is because the more satisfied customers you leave, the more likely you are to generate more revenue from those same customers. (source)
36. 59% of customers in the U.S. will walk away after several lousy call center service experiences, and 17% will leave after one bad experience. (source)

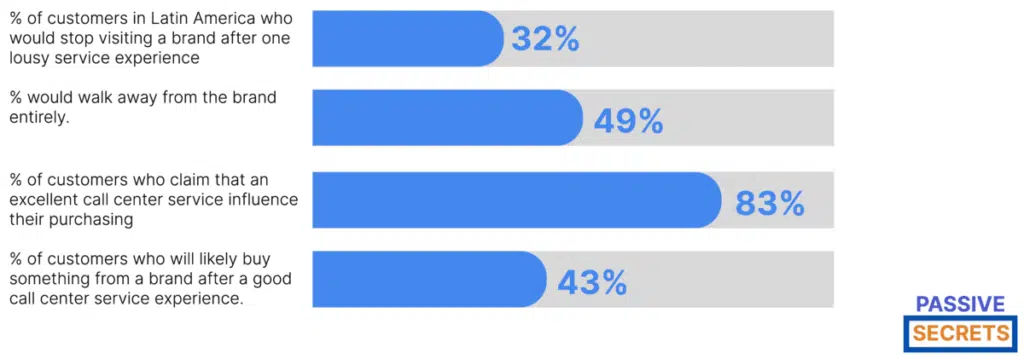
37. 32% of customers in Latin America would stop visiting a brand after one lousy call center service experience, and 49% would walk away from the brand entirely. (source)
38. About 80% of customers in America claim that speed, convenience, knowledgeable help, and friendly call center service are the essential components of a positive customer experience. (source)
39. 83% of customers claim that an excellent call center service has a significant influence on them making a purchase. (source)
40. 42% of customers who experienced poor call center service felt very disappointed, 43% felt unhappy, and 41% felt a rush of anger. (source)
41. 67% of customers who experience poor call center services have told others about their experience, and 65% of them switched to a different brand. (source)
42. 43% of customers will likely buy something from a brand after a good call center service experience. (source)
Call Center Statistics on Performance Metrics
43. A customer satisfaction score gauges how happy or satisfied a customer is with a product or service. It can be determined through surveys, and it is a good indicator of the performance of a call center service. Customer Satisfaction score (CSAT) varies by industry, but a good CSAT score is typically between 75% and 85%. (source)
44. A first-call resolution is the percentage of customers who resolved their dilemmas on the first call. It is an essential metric for monitoring the call center’s operating cost efficiency and service delivery effectiveness. High-performing call centers should attain a first-call resolution rate of 70% or higher. (source)
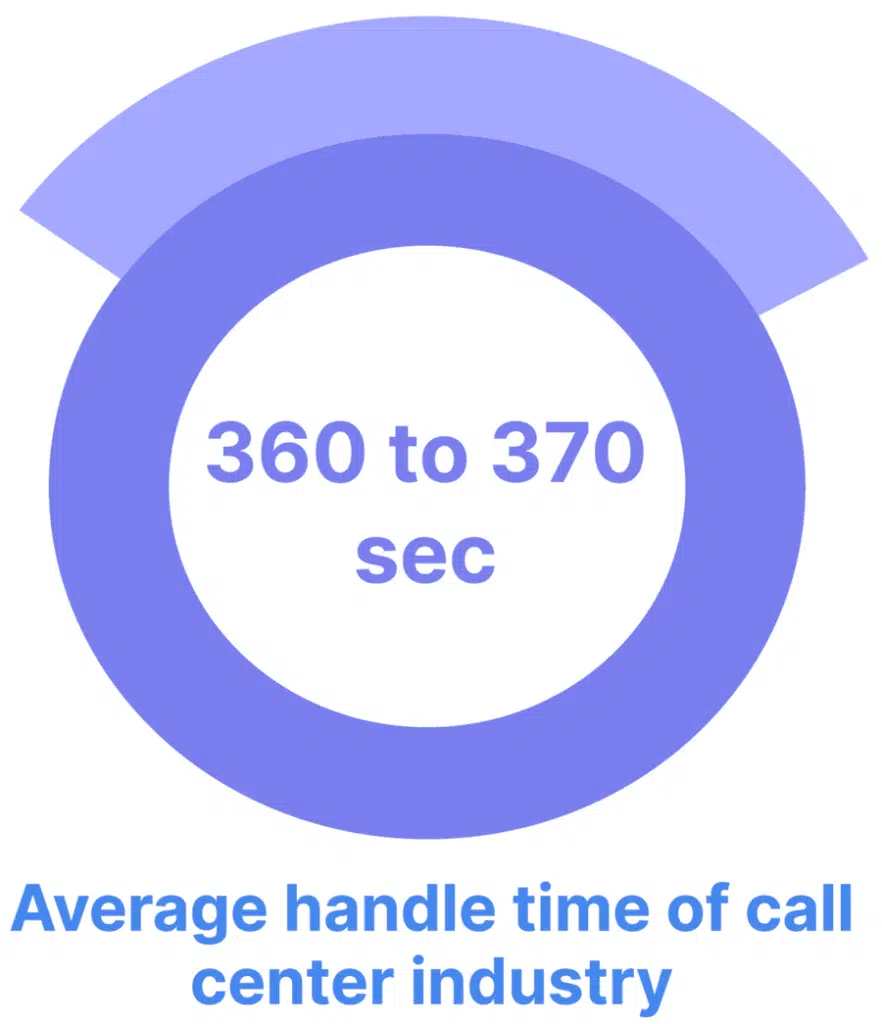
45. The call center industry has an average handle time of over 6 minutes (360 to 370 seconds). An average handle time is a typical call center metric used to estimate the average time needed to complete a transaction. (source)
46. The recommended occupancy rate is about 80- 85%. The average maximum occupancy rate is 83.7%. Occupancy rate measures the percentage of time call center agents have to deal with customers directly. (source)
47. The average speed of answer (ASA) should be between 28 seconds or less. The average speed of answer represents the average time customers are in the queue before their calls are answered. (source)
48. Customer abandonment rate should be between 2-5%. Anything above 5% indicates poor call center performance. Abandonment rate refers to the percentage of callers who hang up before their call is answered. (source)
49. The average service level for most call center companies is about 81.5%. A service level measures the call center’s capacity to answer incoming calls with an established limit for hold time and arrival rates. (source)
Call Center Statistics on Problems Facing the Industry
50. Call center service companies have a 42% attrition rate. This is due to burnout, lack of clarity, collaborations, training, and shift options. An attrition rate measures how fast workers leave a company because of unfavorable circumstances. (source)
51. Some call center service problems arise due to poor service strategies, such as a lack of personalization and service agents. (source)
52. Call center services with longer wait times have a lower CSAT score, leading to business revenue loss. (source)
53. 76% of customers expect personalized interaction with call center service agents. However, this is impossible if the call center service agent does not understand who the customers are and what they want. (source)
54. Technical glitches can affect a call center service. This can be avoided if the call center service software and hardware are maintained regularly. (source)
Latest Call Center Trends For 2024 and Beyond
Several trends are shaping the call center industry in 2024. A combination of technological advancements and ever-changing customer expectations drives these trends.
The call center industry needs to operate more efficiently and effectively.
Hence, these trends are very helpful in ensuring change and advancement in the industry.
1. Automation and AI Technologies Will be More in Use
As technology improves, call centers can now automate more daily tasks.
Automation and AI-powered tools are an excellent and innovative way to improve customer experience.
AI-powered tools such as virtual agents, chatbots, and algorithms can be used to understand and respond to customers.
These algorithms provide instant answers to customers in a short time.
Additionally, AI-powered tools enable call centers to free up more agents and focus on complex interactions.
An example is how AI chatbots handle simple customer inquiries while agents focus on other issues.
AI tools can also analyze customer data and provide agents with real-time insights to improve customer experience.
2. Personalization
Another critical trend is personalization, as customers are not just seeking resolution these days.
You need to stand out by using empathy to create lasting connections with people.
Personalization involves using customer data to tailor the agent’s approach and customize the service experience based on past interactions.
A call center might use data to transfer a customer to an agent who is familiar with their previous issues or to provide them with offers and recommendations that are relevant to their needs.
Personalization can also help create a more positive customer experience and can even improve the chances of customer loyalty.
3. Customers Seek Omnichannel Engagements
Customers expect to engage with businesses on whatever channels of their choice.
Call centers can adapt to this changing behavior by providing service on various channels, including phone, email, chat, social media, and even SMS.
Omnichannel engagement allows customers to switch between channels as needed without losing the context of the conversation.
This creates a seamless and convenient customer experience and can improve customer satisfaction and retention.
4. Increased Use of Cloud Technology
Cloud technology is now widely available, and call centers can adopt cloud-based solutions to their overall strategies.
It is very beneficial regarding flexibility and the ability to scale up or down as needed without investing in additional hardware or infrastructure.
Call centers will also use advanced cloud-based features, such as speech recognition and natural language processing.
Cloud-based solutions can be updated more quickly, which enables call centers to stay up to date with the latest technology.
5. Advanced Analytics
Call centers will increasingly use advanced analytics, especially in 2024, to gain insights from customer data.
This can include analyzing speech, text, and data to recognize customer needs and preferences.
With advanced analytics, call centers can provide more personalized service, make better decisions, and improve operational efficiency.
Analytics can also detect and track trends, allowing call centers to address issues proactively before they become a real problem.
The use of advanced analytics is helping to transform call centers into data-driven and strategic operations.
Final Thoughts
In 2024 and beyond, call centers will continue to be an essential part of customer service.
They provide a human touch, which is often lacking in digital channels, and can offer personalized service that is difficult to replicate elsewhere.
The best call centers invest in technology to improve effectiveness while maintaining a personal connection with their customers.
Ultimately, the success of a call center will be measured not just by the technology it uses but by the quality of the service it provides.

Related Posts:
- B2B Sales Statistics: Latest Insights and Trends
- 50+ Essential Traditional Marketing Statistics & Trends
- 60+ QR Code Statistics, Usage, Forecasts & Trends
- 90+ Useful Marketing Jobs Statistics & Facts (Latest Report)
- Sales Enablement Statistics: Data You Need to Drive Sales Growth
- In-store vs Online Shopping Statistics And Analysis
- Social Media Addiction Statistics
- Latest In-Game Advertising Statistics
- From Passion to Profit: 120+ Creator Economy Statistics
- 80+ Big Marketing Software Statistics
- 45 Interesting Healthcare Marketing Statistics & Trends
- Print Marketing Statistics: Ad Spending, Market Size, & More
- Key Short-Form Video Statistics and Trends You Should Know
- 49 Interesting Emotional Marketing Statistics
- 90 Amazing Millionaire Statistics
- 70+ Top Law Firm Marketing Statistics & NEW Trends
- Millennials on Social Media Statistics
- 23 Most Interesting First Impression Statistics To Know
- 60+ Interesting Storytelling Statistics, Facts & Huge Trends
- Amazon Book Sales Statistics: Intriguing Numbers and Facts
- 61+ Useful Podcast Advertising Statistics And Trends
- 50 Crucial Amazon Advertising Statistics & Trends
- 65+ Must-Know Pay-Per-Click Statistics
- 40+ Interesting Omnichannel Marketing Statistics & Trends
- Multi-Level And Network Marketing Statistics, Facts & Trends
- Virtual Event Statistics & Benchmarks For Marketers & Organizers
- 55 Interesting Direct Mail Marketing Statistics and Trends
- B2B Lead Generation Statistics, Facts, Trends, Benchmarks, & Market Size
- 52 Valuable Trade Show Statistics and Trends
- 100+ Top Digital Marketing Vs. Traditional Marketing Stats
- 110+ Important Social Media Advertising Statistics & Trends
- 50 Interesting Organic Vs Paid Search Statistics To Know
- 41+ MOST Important Copywriting Statistics To Know
- 80+ Useful Sales Funnel Statistics & Conversion Rates
- 40+ Latest Multi-Channel Marketing Statistics & Huge Trends

