
Technology is the greatest innovation man has ever made.
The growing number of the internet and mobile devices has given us easy access to technologies that were unthinkable 50+ years ago.
However, everything has two sides — the good and the dark sides.
And yes, so does technology. As great as technology is, it is very addictive.
The fascinating nature of technology has made people addicted.
Technology addiction is very dangerous. For example, spending too much time on the internet is detrimental to both your physical and mental health.
People all across the world are spending more time on social media, playing computer games, and browsing the web without thinking about how it will affect them.
Since technology is so ingrained in our everyday lives, most people don’t consider it an addiction.
Let’s check out the latest technology addiction statistics to see just how much this addiction can affect our daily lives.
Key Technology Addiction Statistics
- 31% of adults have used AI tools like ChatGPT or Gemini, but only 15% trust AI content more than human-written content.
- Nearly 60% of Russians under 34 are addicted to devices and the internet, vs 40% of adults 45+.
- 72% of teens have tried AI companions, with over half using them regularly.
- Over 40% of kids aged 9–14 show signs of video game addiction; a third are dependent on social media.
- 56% of consumers watch 3+ hours of TV daily; the heaviest viewers are 50–67 years old.
- 48% of U.K. teens feel addicted to social media; 57% of girls vs 37% of boys. (66)
- 46% of Chinese university students used AI chatbots last month, showing light to moderate dependence.
- Americans check their phones 144 times daily, and 75% won’t leave home without them.
- U.K. children spend 134 minutes on TikTok, 49 minutes on Instagram, and 19 minutes on Facebook per day.
- 19% of male teens have gaming disorders vs 7.8% of females; teens average 2 hours/day gaming.
General Technology Addiction Statistics
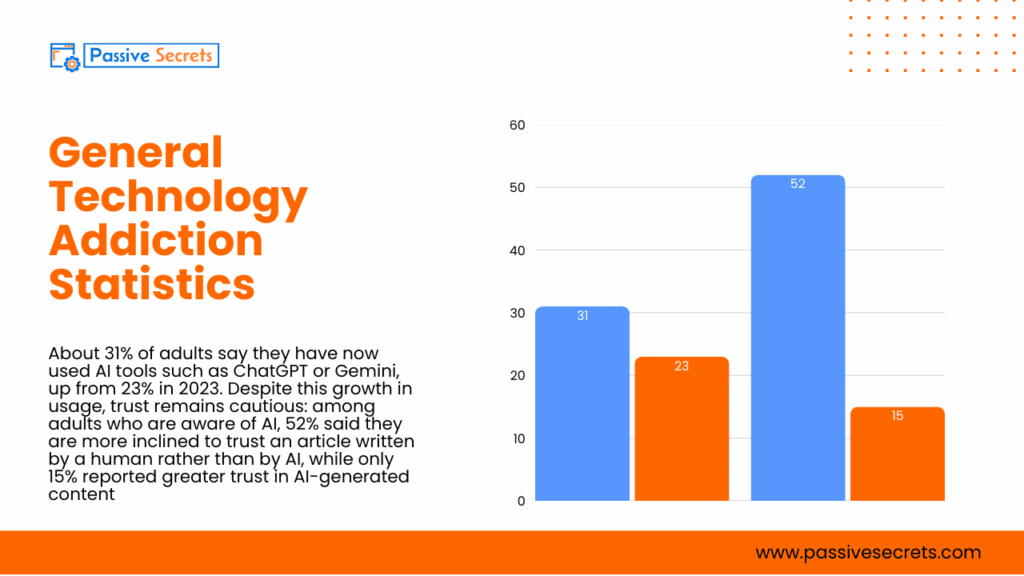
1. About 31% of adults say they have now used AI tools such as ChatGPT or Gemini, up from 23% in 2023. Despite this growth in usage, trust remains cautious: among adults who are aware of AI, 52% said they are more inclined to trust an article written by a human rather than by AI, while only 15% reported greater trust in AI-generated content. (source)
2. In 2024, children aged 4–15 watched an average of 3 hours and 20 minutes of broadcast TV per week, including live and recorded programs, according to Barb data. This represents an 11% drop, or 24 minutes less, compared with 2023. (source)
3. In 2025, 56% of consumers watch three or more hours of TV daily, a decline from 61% in 2024 and 63% in 2023. The heaviest viewers are aged 50–67, with 66% watching at least three hours a day, compared to 52% of 18–30-year-olds and 50% of those aged 31–49. (source)
4. Live TV has seen the sharpest decline, with 28% of consumers saying they generally don’t watch it daily, up from 24% in 2024 and 20% in 2023. The drop is most notable among younger audiences: 41% of under-30s typically avoid live TV, compared with 27% of 31–49-year-olds and 20% of those over 50. When younger viewers do watch, they usually watch for 30 minutes to an hour, whereas older viewers typically watch for 1–2 hours. (source)
5. Streaming TV viewing has also declined, with the share of people watching three or more hours dropping by four percentage points and more viewers now tuning in for 1–2 hours. Currently, a third of consumers stream TV for 1–2 hours daily. Viewers under 30 watch the most, with about a quarter streaming 1–2 hours and another quarter watching 3–4 hours per day. Only 8% of younger viewers typically skip streaming, compared with 27% of those over 50. (source)
6. Currently, 64% of consumers report watching Netflix at least once a week. Amazon Prime and Disney+ have seen the biggest gains, each adding four percentage points to their weekly viewers. Prime now reaches 49%, its highest level since tracking began, while Disney+ remains slightly below its 2023 peak of 38%, at 35% this year. (source)
7. Among streaming platforms, 18-30-year-olds are the heaviest viewers of Netflix (77%), Hulu (57%), and Disney+ (46%). Those aged 31-49 lead in watching Prime (55.5%), Paramount (31%), YouTube TV (19%), and Apple TV (13.5%). Peacock, Apple TV, and Sling, however, show a more balanced age distribution among their viewers. (source)
8. Adults aged 18-30 are the most active music streamers, with 61% listening daily, compared to 46% of 31–49-year-olds and only 20% of those over 50. Meanwhile, nearly 29% of 50–67-year-olds don’t stream music at all, versus just 5% of under-30s. (source)
9. About 72% of teens have used AI companions at least once, with over half (52%) interacting with them regularly, meaning a few times per month or more. (source)
10. Daily users account for 13% of all teens surveyed (8% several times a day and 5% once a day), while the most common pattern is using AI companions a few times per week, reported by 21% of teens. (source)
11. 33% of teens use AI companions for social purposes, such as practicing conversations, seeking emotional support, role-playing, or engaging in friendship or romantic interactions. (source)
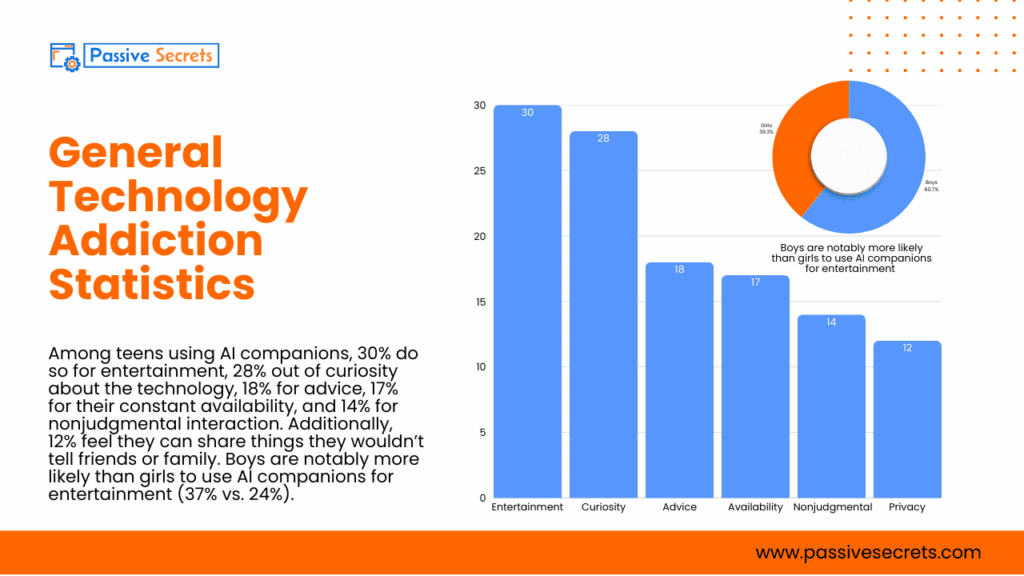
12. Among teens using AI companions, 30% do so for entertainment, 28% out of curiosity about the technology, 18% for advice, 17% for their constant availability, and 14% for nonjudgmental interaction. Additionally, 12% feel they can share things they wouldn’t tell friends or family. Boys are notably more likely than girls to use AI companions for entertainment (37% vs. 24%). (source)
13. About 31% of teens feel that conversations with AI companions are as good as or better than those with real-life friends (21% say they are about the same, and 10% say more satisfying). Still, most teens (67%) find AI chats less satisfying than talking to humans—47% much less satisfying and 20% somewhat less satisfying. (source)
14. Of teens who use AI companions, 33% have used them for serious or important discussions in place of talking to real people, with 17% doing so once or twice, 12% occasionally, and 4% frequently. (source)
15. Of AI companion users, 24% have disclosed personal or private details—such as their real name, location, or secrets—to an AI (13% once or twice, 8% occasionally, 4% frequently), while 74% have never shared such information. (source)
16. About one-third of teens (33%) use AI companions for social interaction and relationships. Although not all of this is necessarily harmful, when paired with the 33% who choose AI over humans for serious conversations and the 24% who share personal information, it suggests that many teens are engaging with AI companions in ways that could be concerning. (source)
17. According to a 2022 survey of internet users in the United States, nearly half of respondents (48%) deemed themselves addicted or somewhat addicted to digital devices. (source)
18. According to Ofcom’s Report 2023, the typical person in the United Kingdom spends 8 hours and 41 minutes using an electronic device rather than sleeping. (source)
19. It is estimated that children and teenagers aged 8 to 28 spend approximately 44.5 hours each week in front of digital screens. (source)
20. Approximately 23% of children and teenagers have reported feeling addicted to video games. That translates to 31% males and 13% females. (source)
21. About half of the teens in the US feel addicted to smartphones. (source)
22. Those in affluent households (39%) find it harder to disconnect from tech compared to their counterparts in low-income households (30%). (source)
23. A striking 65% choose to sleep close to their smartphones. (source)
Technology Addiction Statistics By Country
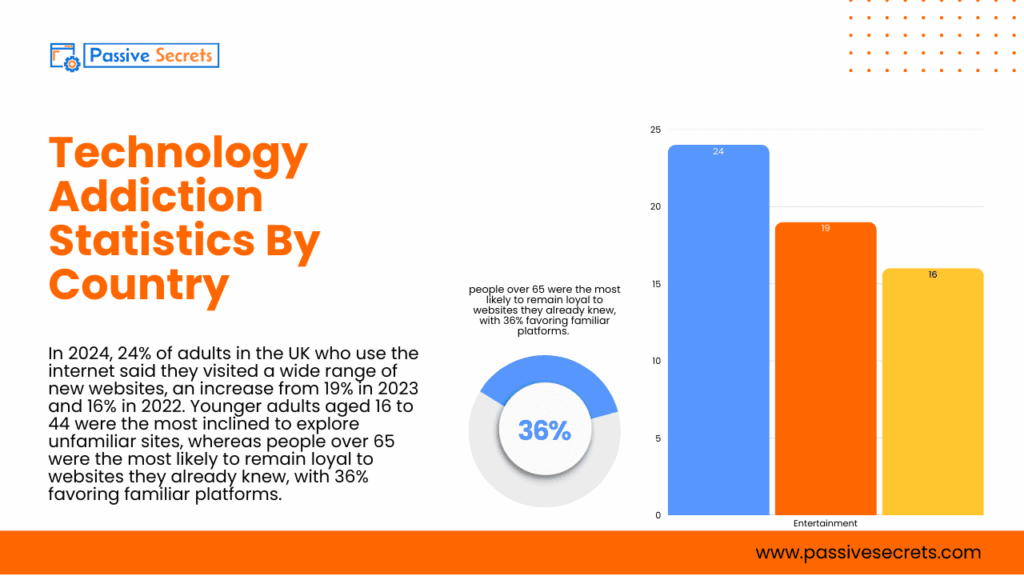
24. In 2024, 24% of adults in the UK who use the internet said they visited a wide range of new websites, an increase from 19% in 2023 and 16% in 2022. Younger adults aged 16 to 44 were the most inclined to explore unfamiliar sites, whereas people over 65 were the most likely to remain loyal to websites they already knew, with 36% favoring familiar platforms. (source)
25. A higher share of male internet users reported not using any social media apps or sites compared to females (11% versus 7%). Men were also more likely than women to upload, watch, or share live-streaming content (69% vs. 61%), while women were slightly more likely to use apps and sites for messaging or making calls (96% vs. 94%). (source)
26. More than half of adults in the UK (53%) play games, with mobile phones being the most popular gaming device. Although gaming participation rose during the COVID-19 pandemic (reaching 60% in 2020), the number of adult gamers has gradually declined in recent years. Gaming is especially common among younger people, with 85% of 16-24-year-olds playing, compared to just 25% of adults aged 65 and older. (source)
27. Nearly 46% of Chinese university students reported using AI chatbots in the past month, with most using them one to three days per week (78.5%) and exhibiting light (38.2%) to moderate (37.6%) levels of dependence. (source)
28. Digital dependency was notably more common among younger generations in Russia. Close to 60% of respondents under 34 acknowledged being addicted to electronic devices and the internet, whereas only around 40% of adults aged 45 and older reported experiencing signs of addiction to gadgets and online use. (source)
29. South Africans lead in daily internet usage with 9 hours and 38 minutes. Followed closely by Brazilians at 9 hours and 32 minutes, while Japan averages 4 hours daily, the lowest among the three countries. (source)
30. 56.9% of surveyed Americans admitted they were addicted to their cell phones. (source)
31. According to a survey conducted by Reviews.org, Americans check their phones 144 times every day. (source)
32. 75% of Americans are reluctant to leave their phones at home. (source)
33. In 2024, children in the United Kingdom spent the most time on TikTok, averaging 134 minutes per day on the platform. Instagram ranked next, with daily usage among UK children averaging 49 minutes, while Facebook saw significantly lower engagement, at about 19 minutes per day among children aged four to 18 during the same period. (source)
34. On average, Brazilians spend 41 years, 3 months, and 13 days of their life on the internet. However, Hong Kongers spend over 44 years browsing online. (source)
35. The average Australian spends up to 9 hours and 14 minutes every week, after work. (source)
36. The Japanese have the least amount of time on the internet, spending only 11 years, 4 months, and 13 days. (source)
37. In Germany, residents dedicate 5 hours and 19 minutes weekly to streaming videos. They also dedicate 4 hours and 12 minutes per week to social media. The French do something similar. They dedicate 6 hours and 39 minutes weekly to social media and 6 hours and 18 minutes weekly to streaming movies. (source)
38. Americans spend the most time streaming movies on video platforms like Netflix – an average of 5 hours and 23 minutes weekly. (source)
39. UK residents spend an average of 4 hours and 36 minutes weekly playing online games. (source)
40. Canadians dedicate 8 hours and 19 minutes weekly to social media. (source)
41. Over 50% of surveyed UK residents admitted they can’t go a day without using the internet. (source)
Smartphone Addiction Statistics
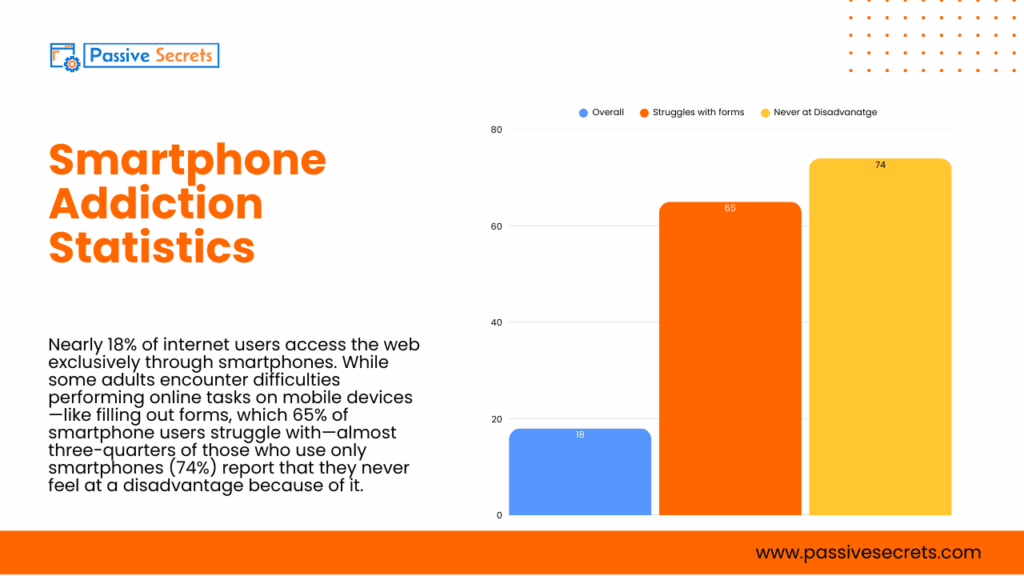
42. Nearly 18% of internet users access the web exclusively through smartphones. While some adults encounter difficulties performing online tasks on mobile devices—like filling out forms, which 65% of smartphone users struggle with—almost three-quarters of those who use only smartphones (74%) report that they never feel at a disadvantage because of it. (source)
43. On average, 71% of individuals prioritize phone time over time with their partner. 52% reported dedicating an extra three to four hours daily to their phones than to their romantic partners. (source)
44. 80% of women check their phones before saying ‘good morning’ to their partners. Over three-quarters (78%) of women admit to spending more time on their phones than with their love partners, compared to 64% of men. (source)
45. Alarmingly, 17% of women said they will interrupt lovemaking or intimacy to check their phones. (source)
46. Majority of people (54%) prefer to spend time on their phone than in the presence of their partner. (source)
47. A quarter (25%) of adults say cell phone use has caused disagreements in their relationship. 28% of men claim phone use has prompted arguments, but only 22% of women say the same. (source)
48. Almost half of Americans say they’re addicted to their phones. (source)
49. 75% of Americans check their phones within five minutes of receiving a notification. (source)
50. Silencing mobile phones (no sound or vibrations) leads to increased mobile phone use and phone-checking behaviors in general. (source)
51. More than half of Americans claim they haven’t gone more than 24 hours without their phone. (source)
52. Worldwide smartphone mobile network subscriptions totaled nearly 7.3 billion in 2025 and are projected to surpass 7.9 billion by 2028. China, India, and the United States account for the largest shares of these subscriptions globally. (source)
53. The average American smartphone owner unlocks their phone 150 times daily. (source)
54. According to 31% of parents, the third most common cause of disagreement between parents and teenagers is screen usage. (source)
55. 48% of teenagers spend more time socializing with close friends online than in person. 40% of them socialize more in video games than offline. (source)
56. 45% of people have texted or used their phone while driving. (source)
57. The majority of Gen X (52%), and Millennials (52%), admit to using their phones while driving. (source)
58. Users with a high Fear of Missing Out will use their phone far more when it is in silent mode. (source)
Social Media Addiction Statistics
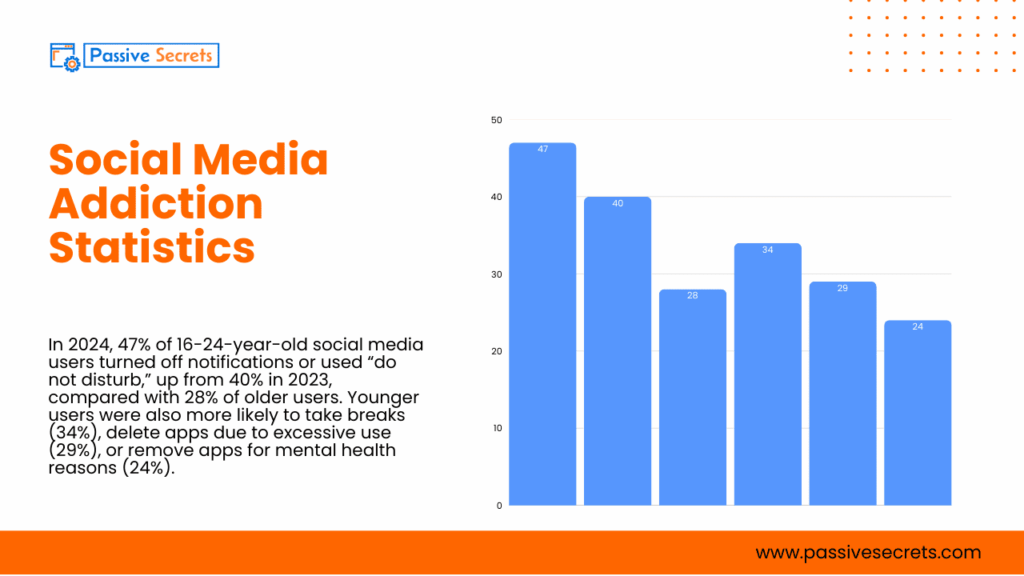
59. In 2024, 47% of 16-24-year-old social media users turned off notifications or used “do not disturb,” up from 40% in 2023, compared with 28% of older users. Younger users were also more likely to take breaks (34%), delete apps due to excessive use (29%), or remove apps for mental health reasons (24%). (source)
60. Parents ranked social media addiction as one of their top three concerns for their children, alongside climate change, war, and housing costs. Additionally, 8% reported enforcing stricter screen-time limits after watching the Netflix series Adolescence, which highlights the risks of online misogyny. (source)
61. In recent years, the number of parents reporting social media use among 3-5-year-olds has grown. About a quarter of children used social media in 2021–2022, rising to 29% in 2023 and 37% in 2024. Of these children, 36% have their parents use social media on their behalf, 42% use it alongside their parents, and 19% use the apps independently. (source)
62. Individuals from lower socioeconomic backgrounds may be more likely to exhibit problematic social media use. (source)
63. According to a study, getting “likes” on social media stimulates the same brain circuits in teenagers that are triggered by earning money or eating chocolate. (source)
64. According to Nicholas Kardaras, author of Glow Kids, persistent overstimulation from social media networking causes the neurological system to enter fight-or-flight mode. This worsens problems like ADHD, teen depression, oppositional defiant disorder, and teen anxiety. (source)
65. Frequent use of social media really rewires the developing teen brain to always seek instant pleasure. As a result, it can lead to other addictive behaviors. (source)
66. In the U.K, 48% of social media users between 16 and 18 years reported feeling addicted to social media. 57% of female teens felt addicted to online platforms, compared to 37% of boys. (source)
Internet Addiction Statistics
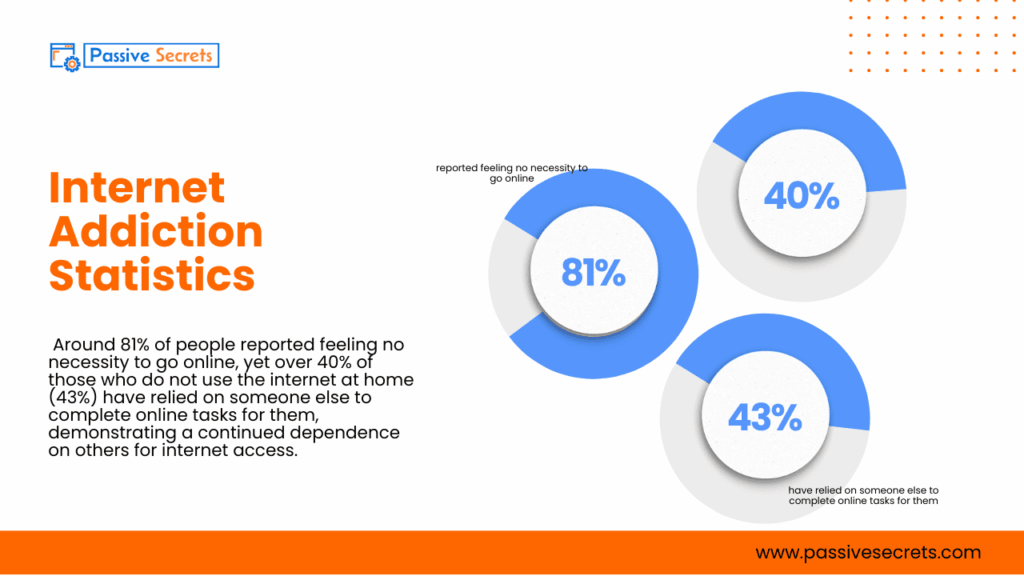
67. Around 81% of people reported feeling no necessity to go online, yet over 40% of those who do not use the internet at home (43%) have relied on someone else to complete online tasks for them, demonstrating a continued dependence on others for internet access. (source)
68. According to a 2022 internet addiction test, the majority of prevalence studies indicate that internet addiction affects between 1% and 10% of the population. In contrast, Asian researchers discovered rates as high as 25%. (source)
69. In another study, 4.1% of students were internet addicts. Also, the study found that 28.5% of the students were at risk of having internet addiction. (source)
70. By the second quarter of 2025, a global survey showed that internet users in the Philippines watched an average of 20.48 hours of online video content per week. Of this total, more than 11 hours weekly were dedicated specifically to short-form online videos. (source)
71. According to Quartz, South Africa is the world’s most internet-addicted country. South Africans spend at least 9.5 hours online daily. Other countries like Brazil, the Philippines, Argentina, and Colombia also top the list of internet-addicted countries. (source)
Gaming Addiction Statistics
72. A longitudinal study tracking over 4,000 children from ages 9–10 found that by age 14, roughly a third had developed a growing addiction to social media, about a quarter were increasingly dependent on their mobile phones, and over 40% showed signs of video game addiction. (source)
73. 3-4% of players are hooked to video games, and 8.5% of young people aged 8 to 18 suffer from gaming disorders. (source)
74. Researchers discovered that between 0.3 and 1.0 percent of the general population could be diagnosed with internet gaming disorder. (source)
75. A 2021 systematic review and meta-analysis 2 revealed that the global prevalence of gaming disorder is 3.05%. This suggests that gaming disorders could affect up to 60 million people (or more). (source)
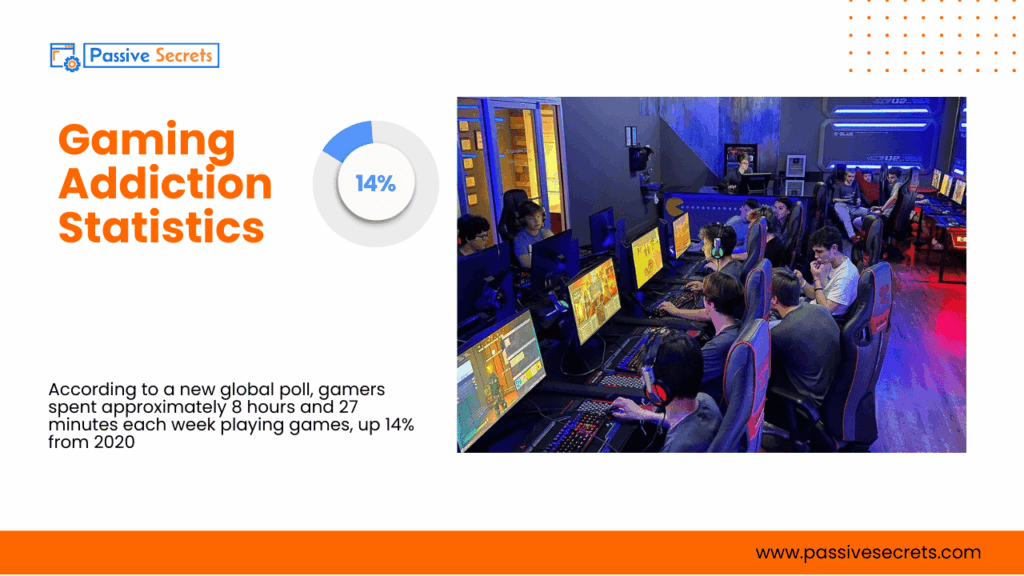
76. According to a new global poll, gamers spent approximately 8 hours and 27 minutes each week playing games, up 14% from 2020. (source)
77. Male teenagers are more prone than female teens to develop internet gaming disorder (IGD). 19% of male teenagers have gaming disorders, compared to 7.8% of females. Teens spend an average of 2 hours daily on gaming. (source)
Final Thought
The rise of AI tools, social media, smartphones, and gaming has transformed how teens and adults interact with technology, sometimes to addictive extremes.
From teens spending hours on TikTok to adults checking their phones over 140 times a day, these statistics reveal a growing reliance on digital devices that cannot be ignored.
Awareness is the first step: understanding these trends can help families, educators, and policymakers address technology addiction before it takes a deeper toll on mental health and daily life.
FAQs
Other Statistics Posts
- Fiverr Statistics: Can You Still Make Money?
- 70+ Interesting Upwork Statistics & Key Facts
- 100+ Animation Statistics: The Ultimate Guide To The Industry’s Trends and Insights
- Shocking Social Media Addiction Statistics You Should Know
- Spotify Statistics: Latest Report on The Music Streaming Platform
- 50+ Useful Video Game Addiction Statistics, Facts & Huge Trends
- 50+ Vital Internet Safety Statistics & Facts You Must Know
- Internet Dangers Statistics: A Look At The Internet’s Dark Side
- 60+ QR Code Statistics, Usage, Forecasts & Trends
- The Future of Learning: 50+ Top EdTech Statistics
- The Web3 Statistics Report: Trends, Insights, and Predictions

