Relationships are at the heart of the human experience. They shape our lives, influence our decisions, and bring us joy and heartbreak.
But have you ever wondered about the numbers behind relationships? What do the statistics say about love, marriage, and everything?
In this exploration of relationship statistics, we’ll get into the fascinating world of data and uncover insights that might surprise you.
Whether you’re single, married, or somewhere in between, these relationship statistics offer a unique perspective on the complexities of human connection.
They reveal the universal experiences we share, the challenges we face, and the resilience that keeps us striving for meaningful relationships.
So, let’s embark on this journey together and discover what the numbers say about the most important aspect of our lives—our relationships.
Key Relationship Statistics (Editor’s Top Picks)
- The U.S. dating services market is expected to reach $3.6 billion in revenue by 2024.
- One-third (33%) of daters are now more open to dating people from other cities.
- About 60% of long-distance relationships last for a long time.
- The average long-distance couple sends 343 texts to each other every week and spends eight hours on the phone or video chatting.
- In the United States, 3.75 million married couples live apart.
- 39% of Americans have previously dated someone with an age difference of 10+ years.
- Physical attractiveness (39%) and open-mindedness (37%) are the top perceived benefits of dating younger.
- Emotional maturity (55%) and financial freedom (44%) are the top perceived benefits of dating older.
- Less than 2% of people marry their high-school love interests.
- About two-thirds of romantic relationships begin platonically.
- According to research, eharmony is the top online dating site for meeting people interested in real relationships.
- There has been a 15% rise in US adults viewing online dating positively.
- Approximately 67% of Tinder users are men, leaving around 33% as women.
- 84% of online daters want a romantic relationship, while 24% want a sexual relationship.
- 117.6 million Americans, or 46% of those aged 18 and above, are single.
- Many singles view dating as increasingly costly, with 60% considering it an unaffordable luxury.
- Singles in the U.S. agree on the top three crucial factors in a healthy relationship: trust, effective communication, and mutual respect.
General Relationship Statistics
1. The U.S. dating services market is expected to reach $3.6 billion in revenue by 2024. (source)
2. 63% of daters admitted to looking for emotional maturity in a partner or potential one more than physical looks. (source)
3. One-third (33%) of daters are now more open to dating people from other cities. (source)
4. During a survey, 39% of participants wanted TV shows to feature more characters representing interracial couples. (source)
5. A significant majority (76%) of survey respondents reported experiencing or initiating “ghosting” in dating. Nearly 60% claimed to have been ghosted, and 45% admitted to ghosting others. (source)
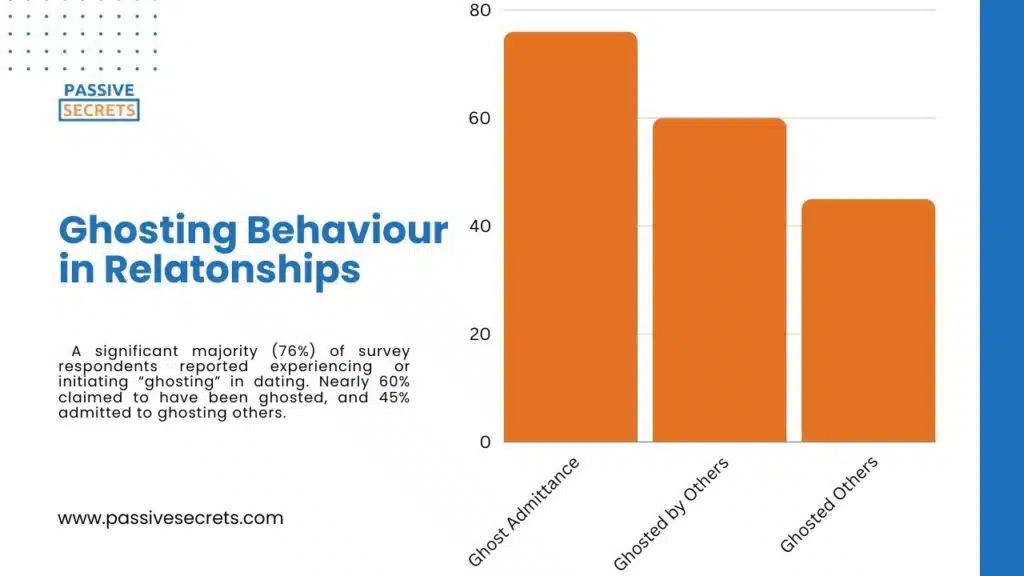
6. Statistics show that 44% of men and 47% of women have engaged in ghosting behaviour. Interestingly, 64% of men admitted to being ghosted themselves compared to 57% of women. (source)
7. One-fourth of Americans, including 35% of Generation Z individuals, state that they are not actively seeking romantic relationships. (source)
8. 80% of Americans say one can have a happy and fulfilling life without marriage. Also, half of single Americans explicitly say they prefer to be alone and that singlehood is the most meaningful, authentic, and fulfilling way of life. (source)
9. A significant majority (80%) of Americans consider finding a suitable romantic partner more challenging than finding the right job. (source)
10. In Germany, both men (59%) and women (almost 65%) expressed a general interest in topics related to relationships and romantic partnerships. (source)
Long Distance Relationship Statistics
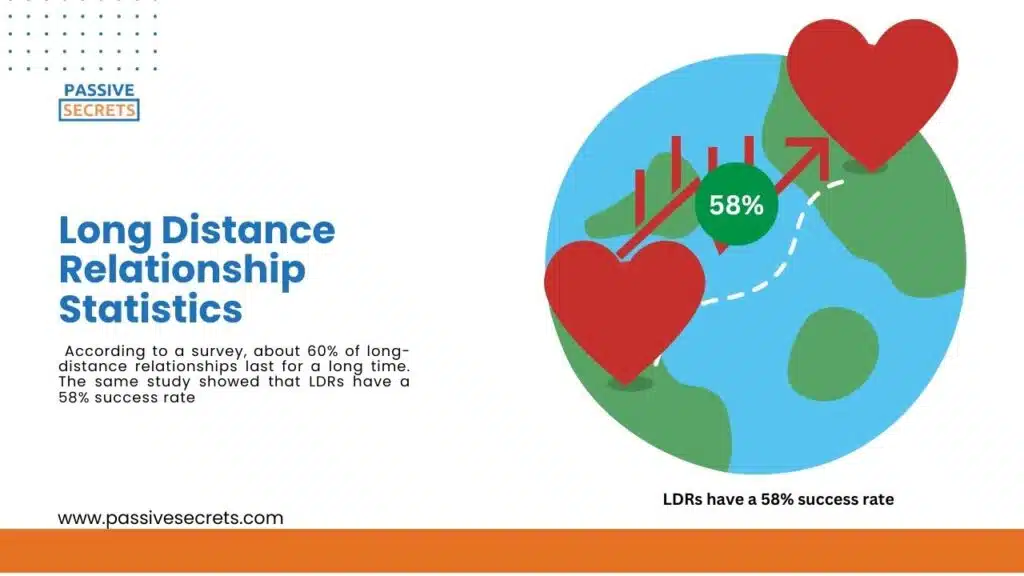
11. According to a survey, about 60% of long-distance relationships last for a long time. The same study showed that LDRs have a 58% success rate. (source)
12. The 4-month mark is the hardest part of every long-distance relationship. However, if the relationship can survive eight months, it becomes easier. (source)
13. Every week, the average long-distance couple sends 343 texts to each other and spends eight hours on the phone or video chatting. (source)
14. 55% of Americans who experienced long-distance relationships reported feeling closer to their partner in the long run despite physical distance. Moreover, 69% said they communicated more frequently with their partner during that time. (source)
15. 81% of those in long-distance relationships found that in-person visits became more intimate and special due to the rarity of these occasions. (source)
16. In the United States, 3.75 million married couples live apart, with long-distance relationships accounting for 10% of all marriages. (source)
Age Gap in Relationships Statistics
17. In 2017, opposite-sex marriages in France exhibited a variety of age differences between partners. The most common was a one-year gap in favour of men, constituting 12% of all marriages. Conversely, marriages where the man was at least 20 years older than his partner were rarer, representing 1.3% of unions. (source)
18. 39% of Americans have previously dated someone with an age difference of 10+ years. (source)
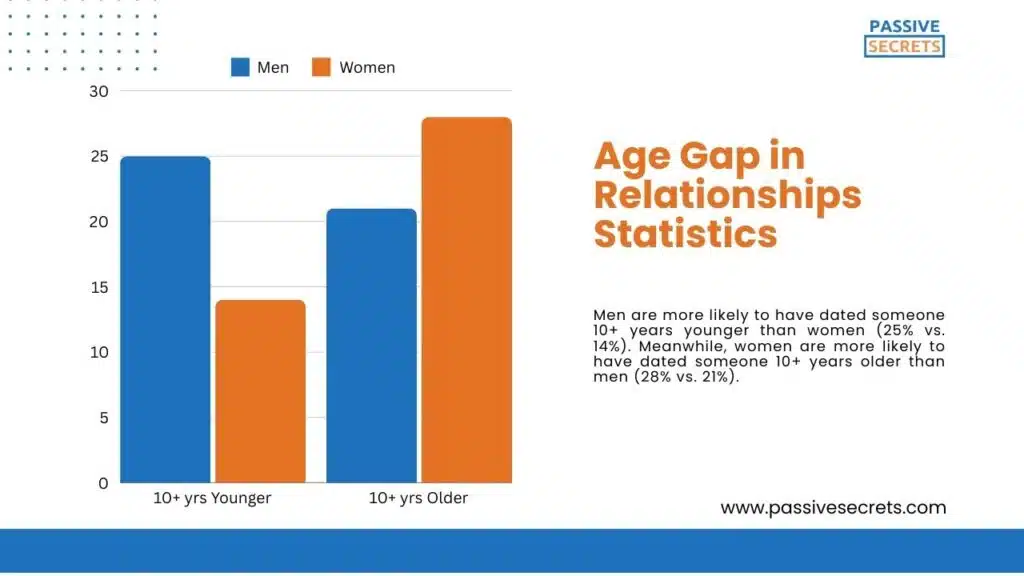
19. Men are more likely to have dated someone 10+ years younger than women (25% vs. 14%). Meanwhile, women are more likely to have dated someone 10+ years older than men (28% vs. 21%). (source)
20. Many single Americans are interested in age-gap dating, with 57% stating they would date someone 10 years older than them and 49% saying they would date someone 10 years younger. (source)
21. Unmarried Americans 35 and older are more likely than those under 35 to date someone 10 years younger than them. (source)
22. Most Americans accept large age gaps in romantic relationships, with 60% believing it is acceptable for a woman to date a younger man and 71% approving of a man dating a younger woman. (source)
Older Americans are generally more accepting of such age gaps in heterosexual relationships, with 75% of those over 35 approving of large age differences.
23. Men and women hold similar views on the acceptability of men dating younger partners (72% of men and 70% of women). However, men are slightly more likely (65%) than women (56%) to find it acceptable for women to date younger men. (source)
24. Physical attractiveness (39%) and open-mindedness (37%) are the top perceived benefits of dating younger. Men (46%) are more likely to mention physical attractiveness as a major advantage than women (33%). (source)
25. Emotional maturity (55%) and financial freedom (44%) are the top perceived benefits of dating older. (source)
26. Americans cite having nothing in common (25%) as the top perceived barrier to age-gap dating. However, of the potential obstacles, nearly half (45%) said none. (source)
27. Concern over social judgment in age-gap relationships decreases with age. Younger Americans (ages 18-34) are more likely (24%) than their older counterparts (14% of 35-54 and 6% of 55+) to worry about societal perceptions. (source)
28. The average age difference in US heterosexual relationships was only 2.3 years. Many couples have a significantly wider gap. (source)
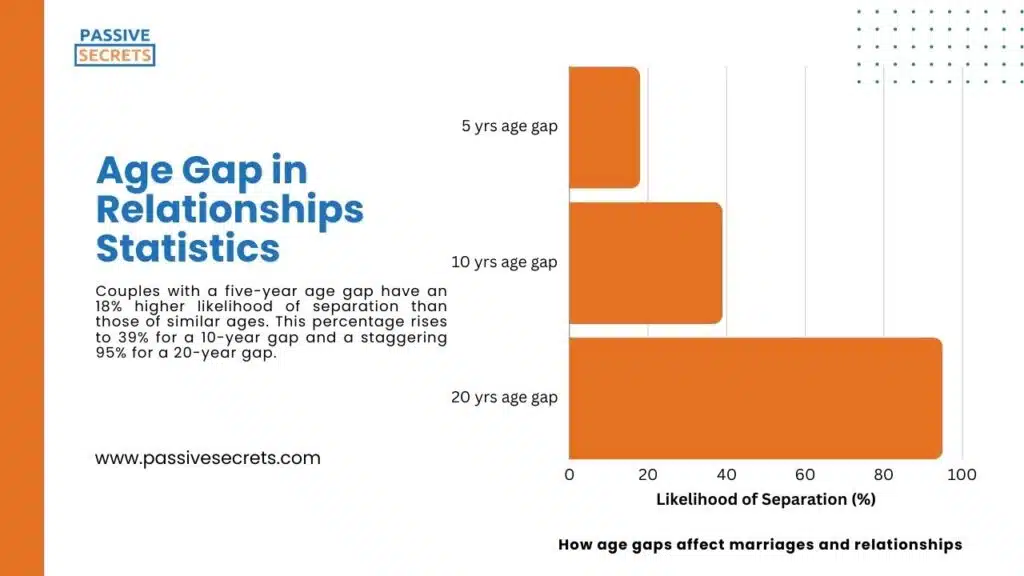
29. Couples with a five-year age gap have an 18% higher likelihood of separation than those of similar ages. This percentage rises to 39% for a 10-year gap and a staggering 95% for a 20-year gap. (source)
30. Men tend to be more satisfied with younger wives and less satisfied with older wives. Likewise, women tend to be more satisfied with younger husbands and less satisfied with older husbands. However, satisfaction tends to decline when partnered with someone older for both men and women. (source)
31. Marital satisfaction declines over time for couples with different age gaps than those with similar ages, eventually levelling off after 6 to 10 years. (source)
32. According to the study, neither the age at which individuals marry nor the year the marriage occurs significantly impacts marital satisfaction. (source)
High School Relationship Statistics
33. Less than 2% of people marry their high-school love interests. Also, for those who do marry, only half of them mark their 10th anniversary. (source)
34. Among teens aged 13-17, only about 1 in 3 have dated or been in a romantic relationship, and fewer than 1 in 5 are currently in a romantic relationship. (source)
35. Most high school relationships typically last around 5-6 months, with a study by the University of Georgia finding an average duration of 6 months to 1 year. (source)
36. However, high school relationships usually last between 8 and 20 months. (source)
37. Over half (54%) of couples who married as high school sweethearts end in divorce. (source)
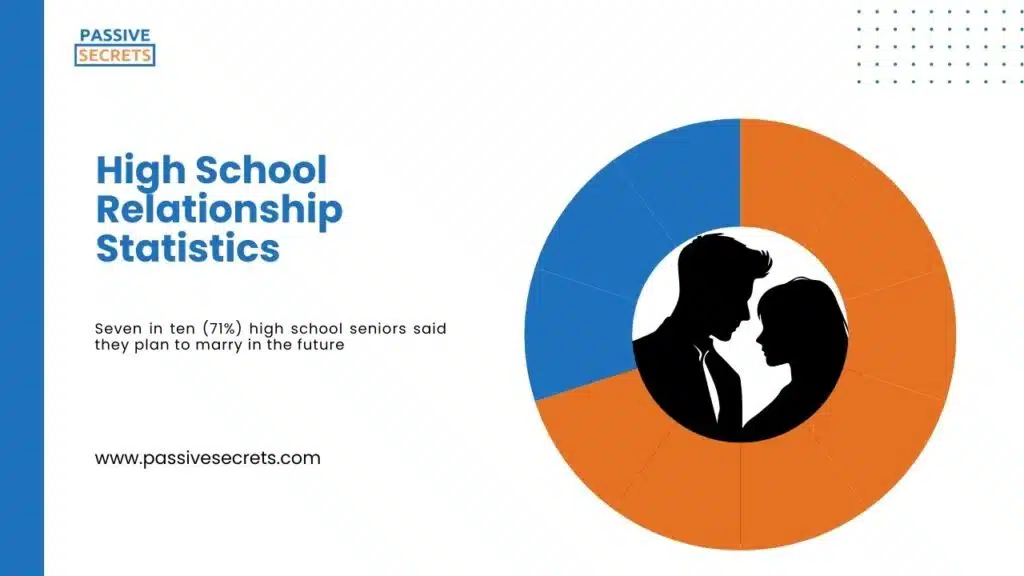
38. Seven in ten (71%) high school seniors said they plan to marry in the future. (source)
Platonic Relationship Statistics
39. More than half of Gen Z teens want to see more platonic connections or friendships in movies and TV rather than romance or sex scenes. (source)
40. About two-thirds of romantic relationships begin platonically. (source)
41. 66% of the surveyed adults stated that their current or most recent romantic connection began as a friendship. (source)
42. Almost half of college students prefer to begin romantic relationships as friends. (source)
43. Strong adult friendships promote well-being and protect against mental health issues like depression and anxiety, with benefits lasting a lifetime. (source)
44. People who have no or low-quality friendships are twice as likely to die early. (source)
45. Research suggests that loneliness—among those who lack solid friendships, romantic partnerships, or other relationships—increases the risk of heart attack, stroke, and premature death. (source)
46. In 2021, 12% of U.S. adults reported not having any close friends, up from 3% in 1990. (source)
Online Dating Statistics
47. According to research, eharmony is the top online dating site for meeting people interested in real relationships. (source)
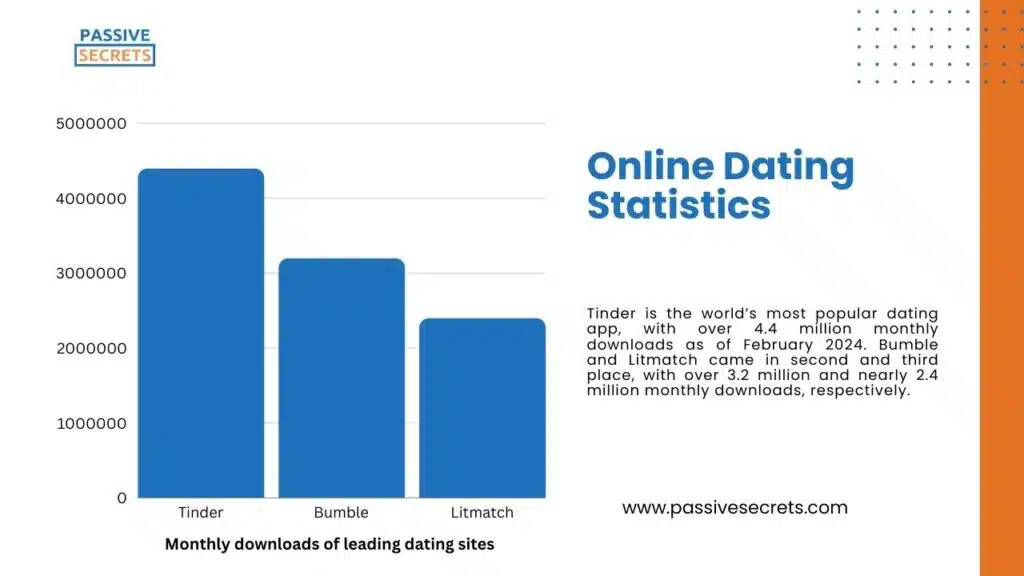
48. Tinder is the world’s most popular dating app, with over 4.4 million monthly downloads as of February 2024. Bumble and Litmatch came in second and third place, with over 3.2 million and nearly 2.4 million monthly downloads, respectively. (source)
49. Tinder boasted a user base of 7.86 million in the U.S. as of September 2019, establishing itself as the leading online dating platform, followed by Bumble, with 5.03 million mobile users. (source)
50. There has been a 15% rise in US adults viewing online dating positively. (source)
51. Conversely, there’s been a 6% decline in the percentage of US adults associating online dating with desperation. (source)
52. Among all internet users, 19% are engaged with online dating platforms, while 27% have previously used them. Of those who have previously used online dating platforms, 36% claim to use them daily for various activities such as messaging, finding matches, or browsing profiles. (source)
53. Recent research suggests that approximately 67% of Tinder users are men, leaving around 33% as women. (source)
54. According to 61% of people using dating apps, the primary reason for doing so is to connect with individuals who share similar interests. 44% seek those with matching values and beliefs, and 42% are looking for a partner for marriage. (source)
Also, 26% of daters use an online dating app to meet someone just to have non-committal fun, and 21% of daters use an online dating app to meet someone because they have a challenging schedule.
55. In 2023, global online dating service users exceeded 381 million, projected to reach 452 million by 2028. (source)
56. 84% of online daters want a romantic relationship, while 24% want a sexual relationship. (source)
Marriage Statistics
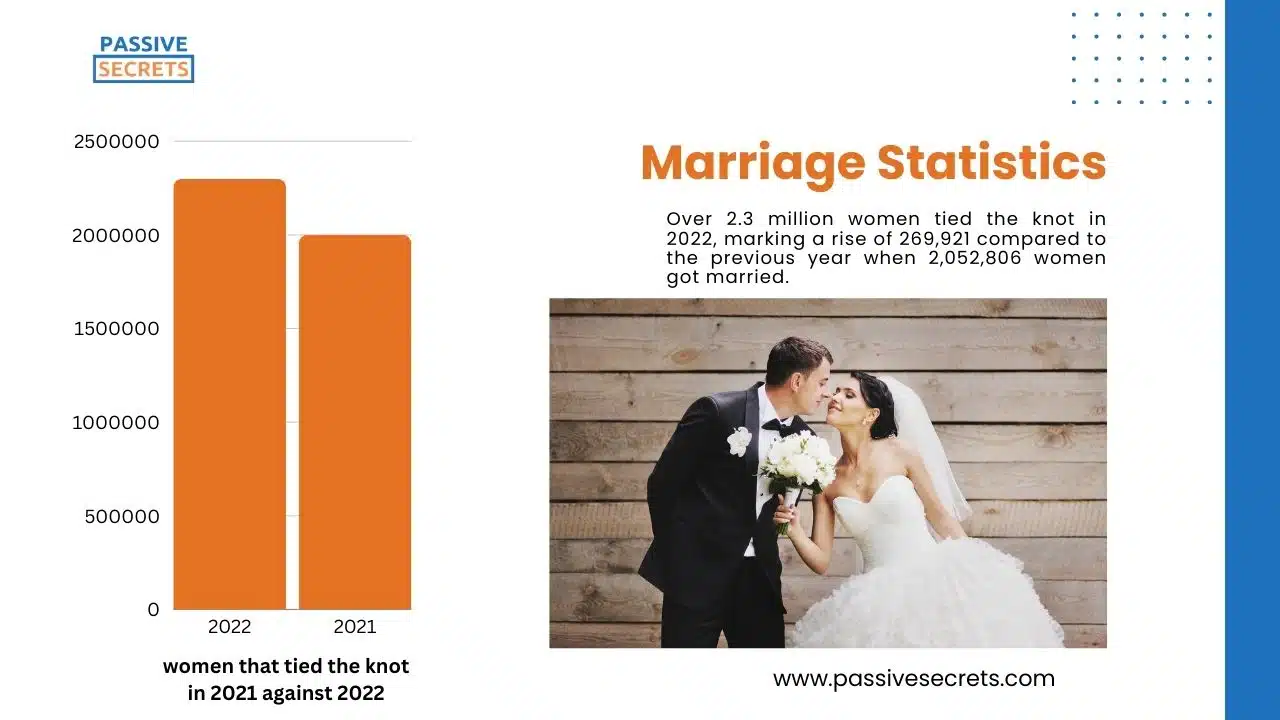
57. The marriage rate grew from 28 marriages out of 1000 single women in 2021, rising to 31.2 per 1,000 single women in 2022. (source)
58. Over 2.3 million women tied the knot in 2022, marking a rise of 269,921 compared to the previous year when 2,052,806 women got married. (source)
59. Utah’s marriage rate remains the highest in the US in 2022, with 43 marriages per 1,000 unmarried women, though slightly lower than 2021’s rate of 49 marriages per 1,000 unmarried women. (source)
60. New Mexico had the lowest marriage rate in 2022, with 21 marriages per 1,000 unmarried women, half the rate of Utah, the state with the highest marriage rate. (source)
61. In 2022, the top quartile of states had marriage rates of at least 35.9 per 1,000 unmarried women, significantly exceeding the national average of 31.23. (source)
62. States with the lowest marriage rates in 2022 (forming the bottom quartile) had 28.8 or fewer marriages per 1,000 unmarried women. (source)
Singles Statistics
63. According to the US Census Bureau, 117.6 million Americans, or 46% of those aged 18 and above, are single. (source)
64. 68% of Americans perceive that the negative perception or stigma associated with being single is gradually disappearing in today’s society. (source)
Single Americans report high satisfaction with the increased time they spend pursuing their passions, as 86% say they love “having more time to pursue my interests and passions.” In addition, 82% of single Americans enjoy the freedom to design a fulfilling lifestyle and appreciate not worrying about a partner’s debt or financial obligations.
65. Many singles view dating as increasingly costly, with 60% considering it an unaffordable luxury. (source)
66. Singles in the U.S. agree on the top three crucial factors in a healthy relationship: trust, effective communication, and mutual respect. (source)
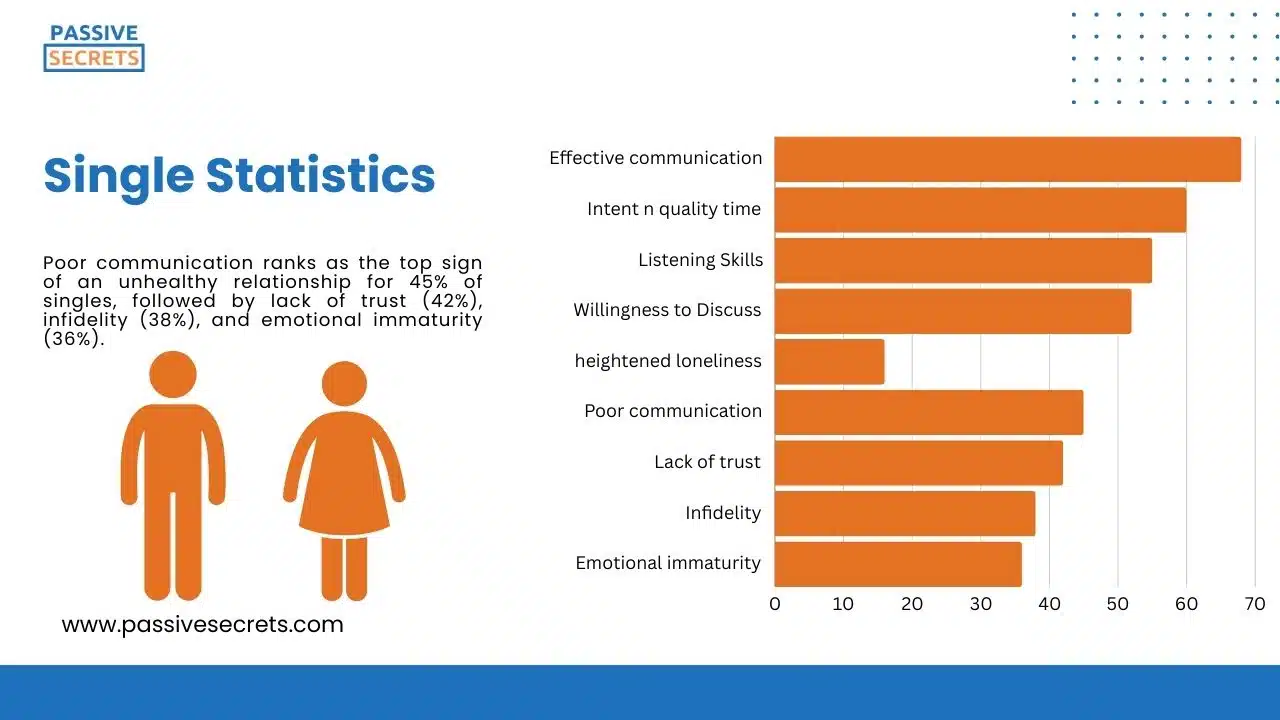
67. 68% of singles believe they can effectively communicate their needs in a relationship. (source)
68. 60% of singles think setting aside quality time shows your intent. (source)
69. 55% of singles discern romantic interest through attentive signals, underscoring the importance of honing active listening skills. (source)
70. 52% of singles view a willingness to discuss feelings as a clear indicator of commitment. (source)
71. One-third of singles report feeling burnt out in their dating lives on occasion, while 52% say they rarely do. (source)
72. About 16% of singles feel heightened loneliness when spending time with couples. (source)
73. Nearly 1 in 5 young singles (19%) feel that loneliness increases their motivation to date, with 55% expressing dating excitement. (source)
74. Poor communication ranks as the top sign of an unhealthy relationship for 45% of singles, followed by lack of trust (42%), infidelity (38%), and emotional immaturity (36%). (source)
75. Most singles (79%, including 83% of Gen Z and Millennials) believe in the possibility of lifelong marriage, while 21% of previously married singles express willingness to remarry. (source)
76. 27% of online daters across all generations are positive about using AI. 63% of Gen Z singles have used artificial intelligence in some capacity, whether for dating or otherwise. (source)
77. 49% of singles express a preference for monogamy in their sexual relationships, indicating that half of single Americans are open to non-traditional sexual relationship structures. (source)
Conclusion
Examining the trends and patterns that underlie our relationships would help us gain valuable insights.
So, whether you’re navigating the wild world of dating, nurturing lifelong friendships, or cherishing the love within your family, remember that the statistics we’ve explored remind us of the beauty, complexity, and endless possibilities relationships bring to our lives.
Considering all these relationship statistics would allow us to create, grow, and celebrate the connections that make life truly worth living.
Frequently Asked Questions
-
What are the statistics for romantic relationships?
2023 data from the Pew Research Center finds that three in 10 Americans are single, and about half (51%) are open to a committed relationship or casual dates. Over half of men (56%) are looking for a committed relationship or casual dates, and less than half of women (44%) say the same.
-
What are the chances of relationships lasting?
According to the Washington Post, breakup statistics decrease once the relationship passes the one-year mark. The five-year mark for unmarried couples has a breakup rate of 20 per cent.
-
Which relationships are most likely to last?
Relationships built on love, trust, intimacy, and mutual respect are more likely to lead to happy and healthy lifelong partnerships.
-
Which relationship lasts the longest?
Relationships where both partners fight fairly.
Related Posts:
- Thought-Provoking Gender Inequality Statistics: 160+ Insights Across Regions
- 110+ Shocking Income Inequality Data You Need to Know
- 50 Interesting Sharing Economy Statistics You Need to Know
- 100+ Animation Statistics: The Ultimate Guide To The Industry’s Trends and Insights
- 80+ Franchise Statistics and Facts You Should Know
- The Future of Learning: 50+ Top EdTech Statistics
- The Web3 Statistics Report: Trends, Insights, and Predictions
- Meme Statistics: Facts, Trends, and Figures That Will Blow Your Mind
- 85+ MOST Interesting Anime Statistics and Facts (NEW Report)
- Board Game Statistics: Revenue, Market Size, Demographics & More
- 125+ Interesting Airbnb Statistics by Country (Deep Insights)
- 50+ Interesting Born Into Poverty Stay In Poverty Statistics
- 90+ Interesting Film Industry Statistics (NEW Report)
- 80+ Alarming Technology Addiction Statistics You Must Know
- 65+ Impressive Chess Statistics and Facts To Know
- Spotify Statistics: Latest Report on The Music Streaming Platform
- 50+ Useful Video Game Addiction Statistics, Facts & Huge Trends
- 50+ Vital Internet Safety Statistics & Facts You Must Know
- Internet Dangers Statistics: A Look At The Internet’s Dark Side
- 50 Interesting Bible Statistics and Facts You Didn’t Know
- 95+ Interesting Dream Statistics and Facts You Can’t Miss
- Dance Statistics: A Deep Dive Into The Rhythm Of Movement
- 40+ Incredible Single Father Statistics You Have to Know
- The Battle of the Sexes: Male Vs. Female Spending Statistics
- 95+ Jaw-Dropping Period Poverty Statistics You Need To Know
- 70 Exciting Love Statistics And Facts (True Love, Intimacy, Marriage, Dating & Relationships)
- 30+ Gentle Parenting Statistics & Facts: Is This Parenting Style Worth It?
- 55+ Useful Black Consumer Spending Statistics (New Report)
- Holiday Spending Statistics: Valentine’s Day, Easter, Thanksgiving, & Christmas

