The age-old battle of the sexes has a new arena – spending habits!
Are men really from Mars and women from Venus regarding how they spend their hard-earned cash?
Let’s look at the fascinating world of male vs. female spending statistics.
From everyday expenses to luxury purchases, gender differences in spending habits can be surprising and enlightening.
Do women shop more than men? Are men more prone to impulse buys? Who spends more on personal care and grooming?
Whether you’re a man or a woman, understanding the spending patterns of the opposite sex can help you make better financial decisions and improve communication with your partner or spouse.
Key Statistics About Male Vs. Female Spending
- Women make 80% of buying decisions.
- The average annual expenditure for men was $35,018 compared to $33,786 for women.
- Women control up to U.S. $31 trillion of all consumer spending worldwide.
- 83% of women will remain loyal to a brand if they like it.
- More than men, women shop at online marketplaces: 43% vs 32%.
- 89% of women claim responsibility for daily household shopping compared to 41% of men.
- Men pay $5,507 per year on personal transportation vs $4,273 for women.
- Men become bored with shopping after 26 minutes, whereas women remain unfazed after two hours.
General Male Vs. Female Spending Statistics
1. 80% of buying decisions are made by women. (source)
2. Though not by much, single males spent more than single women. The average annual expenditure for men was $35,018 compared to $33,786 for women. (source)
![The Battle of the Sexes: Male Vs. Female Spending Statistics The Battle of the Sexes: Male Vs. Female Spending Statistics [2025] ᐈ Passive Secrets](https://passivesecrets.com/wp-content/uploads/2024/05/General-Male-Vs.-Female-Spending-Statistics-1024x576.jpg.webp)
3. A study found that men and women have different attitudes to shopping. (source)
Most women see shopping as a recreational activity. They take their time and are most likely to spot a good deal faster than men. However, men are more straightforward. Most of them prefer to get whatever they need and move on.
4. Approximately US$31 trillion of all consumer spending worldwide is controlled by women. This is approximately 85% of global consumer spending. (source)
5. Women are twice as likely as males to be single homebuyers. In a report, single women accounted for 19% of home buyers. However, single men only accounted for 10%. (source)
6. Men are statistically as prone to overspending as women. (source)
7. 83% of women will remain loyal to a brand if they like it. (source)
8. Compared to their female counterparts, Millennial and Gen Z men tend to spend more money on shoes and clothing. They tend to spend $120 more than women monthly. (source)
9. Also, Millennial males are most likely to spend $20 more than their female counterparts. (source)
10. Globally, men account for 57% of spending on food and drinks. They also spend up to 60% more than women. (source)
11. 37% of female survey respondents said they would spend $50 to $99 on Valentine’s Day gifts. (source)
12. In 2021, single women owned more homes than single males. (source)
13. Women make spending and investment decisions in their households. (source)
14. Overall, male consumers in Australia are more willing to spend money online than female customers. They are willing to spend an average of US $2,314 on online purchases, while women are willing to spend an average of $740.(source)
15. In a 2020 study, 34% of women, compared to 21% of men, indicated they planned to spend less over the holiday season. (source)
16. By 2028, women will possess 75% of discretionary spending. Discretionary spending is non-essential expenses like food, clothes, shelter, etc. (source)
17. Men spend 40% more than women when shopping on various purchases. (source)
18. Men spend 75% more on goods bought in-store than women. (source)
19. Women between 26 and 35 make 59% more online purchases than their male counterparts. However, a closer look at their receipts showed they spend $47 less than men. (source)
20. Men spend $220 per transaction on average compared to $151 for women. (source)
21. Men and women in the United Kingdom (UK) shared similar preferences regarding shopping channels. They both preferred to shop online rather than offline. (source)
22. Men shop more luxury items through mobiles than women in the UK. 5 in 6 men shop for luxury items via mobile devices. However, only 16% of women do so. (source)
What Each Gender Spends The Most On
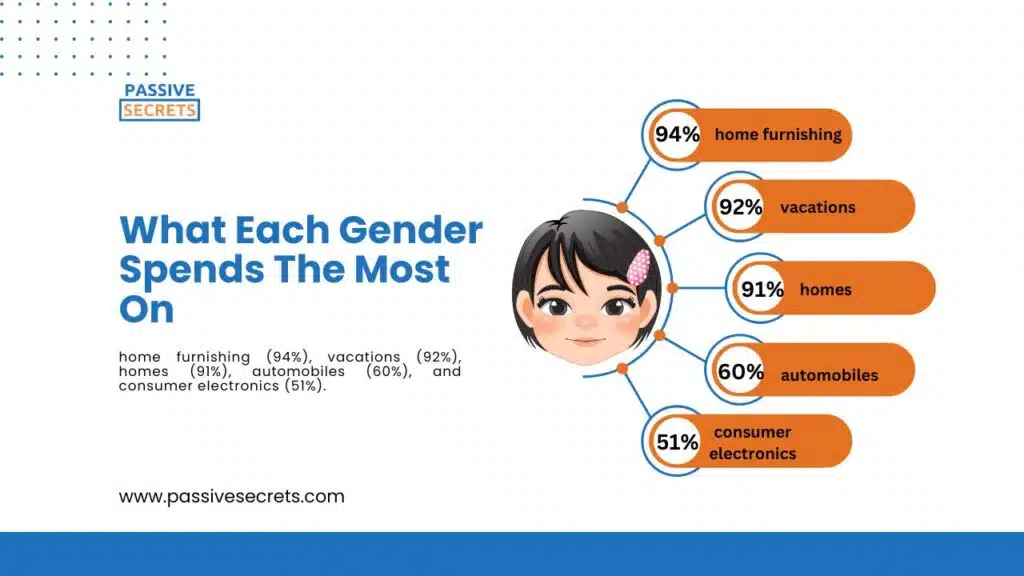
23. On average, women make the majority of decisions in various areas: home furnishing (94%), vacations (92%), homes (91%), automobiles (60%), and consumer electronics (51%). (source)
24. Males spent $4,816 annually on food, compared to $4,446 for women. (source)
25. 89% of women claim responsibility for daily household shopping compared to 41% of men. (source)
26. Men spend $542 a year on alcohol compared to $257 for women, a 2 to 1 advantage. (source)
27. Regarding “other” entertainment, such as sports shoes and indoor workout equipment, men outspend women. On average, they spent $675 instead of $141 for women. (source)
28. Spending on clothes is higher for women, with a yearly expenditure of $1,140 compared to $813 for males. (source)
29. Men spend $625 annually on meats, poultry, fish, and eggs, compared to $592 for women. (source)
30. Regarding nonalcoholic beverages, men spend $309 and women $292. (source)
31. Regarding personal care goods and services, women spend far more than men. On average, women were willing to spend $714 a year on self-care, while males were more likely to spend $297. (source)
32. Women tend to spend significantly more in all healthcare areas. (source)
33. More than men, women shop at online marketplaces: 43% vs 32%. (source)
34. Men outspend women, paying $5,507 per year on personal transportation vs $4,273 for women. (source)
35. Men only spent $206 on pet care but $835 on “audio and visual equipment and services” on average. (source)
36. According to a 2019 Kaiser Family Foundation survey, women spend more on healthcare services at every stage of life than men. (source)
37. As of January 2018, 60.7% of American gamers who spent between $101 and $250 a year on gaming were men and 39.3% were women. (source)
38. Most male and female consumers in the Philippines typically spend PHP 1500 when shopping in-store. Only 10% spent between PHP 5000 and PHP 10,000. (source)
Male vs. Female Shopping Statistics
39. As of the second quarter of 2023, men accounted for 50% of all online clothing and shoe purchases in the United Kingdom. Women came in second, with approximately 46% purchasing apparel, primarily online. (source)
40. Every day, 24% of males shop online. (source)
41. 17% of women shop online daily. (source)
42. Men shop online 70% of the time, compared to women’s 57%. (source)
43. Compared to women, men are likelier to be loyal to brands (41% of men prefer brands they know and trust versus 22% of women). (source)
44. The average online shopper is male, aged 25 to 49. Men buy online at an interest rate of 84.3%, compared to 77% for women. (source)
45. Women (74%) are much more likely than men (57%) to buy something on sale. (source)
46. Men (70%) conduct significantly more online product searches than women (30%). (source)
47. According to a study, men become bored with shopping after 26 minutes, whereas women remain unfazed after two hours. (source)
48. Males dominate the computer and tech product category with 39% compared to 18% of females. (source)
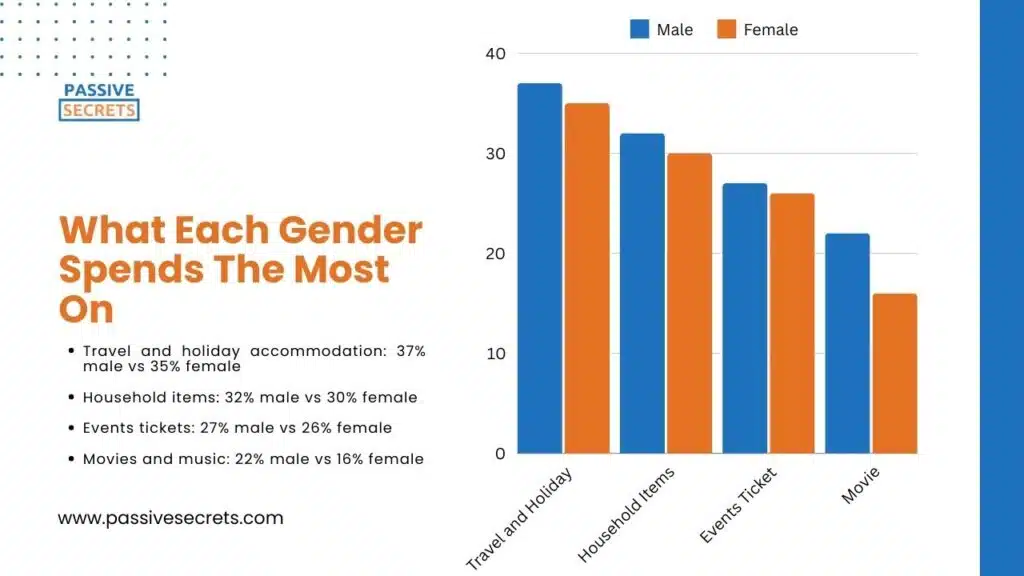
Other male-dominated product categories include:
- Travel and holiday accommodation: 37% male vs 35% female
- Household items: 32% male vs 30% female
- Events tickets: 27% male vs 26% female
- Movies and music: 22% male vs 16% female
49. Conversely, females dominate the clothes and sports goods product category with 46% compared to 14% of males. (source)
Other female-dominated product categories include:
- Books, magazines, and electronic educational literature: 25% female vs 23% male
- Groceries: 18% female vs 14% male
- Medicine: 10% female vs 8% male
50. Men owe 20% more on personal loans than women, at $17,716 versus $14,780. They also owe 16.3% more on auto loans and 9.7% on mortgages. (source)
51. However, women have an average student loan debt of $36,131, which is $943, or 2.7%, more than men’s. (source)
52. Women without a bachelor’s degree earn 78 cents for every dollar earned by men. Also, college-educated women make 74 cents for every dollar earned by men. (source)
53. By 2028, the global male grooming market is expected to be worth approximately $115 billion, up from nearly $80 billion in 2022. (source)
54. Conversely, in 2024, the global Feminine Hygiene market was worth $49.75 billion. The market is expected to grow at 4.83% annually between 2024 and 2028. (source)
55. By 2022, the global femtech market is expected to be worth USD 45.75 billion. It is projected to reach USD 139.51 billion by 2031, with a CAGR of 13.12% during the forecast period. (source)
FAQs
1. What Gender Spends the Most?
According to recent statistics from FinanceBuzz, women tend to spend more than men globally, with women spending nearly $35 trillion on consumer goods.
2. What Percentage of Consumer Spending is by Gender?
While men tend to make more impulse purchases (54%) than women (45%), women drive the bulk of purchases and account for up to 80% of consumer spending.
3. What Gender is the Biggest Customer?
Women are generally considered to be the biggest consumers. They make most household purchasing decisions, accounting for over 70% of purchases in healthcare, housing, food, and transportation categories.
4. Which Gender is More Brand Loyal?
Men are more loyal to brands than women. The statistics showed that 41% of men prefer buying from brands they know and trust versus 22% of women.
5. What do Men Spend Most On?
Men spend more on new cars than women, making up about 62% of new car purchases in the US. They are also the primary consumers of tobacco products, with around 40% of men in the world using tobacco in some form.
Other Related Statistics Posts:
- Thought-Provoking Gender Inequality Statistics: 160+ Insights Across Regions
- 110+ Shocking Income Inequality Data You Need to Know
- 50 Interesting Sharing Economy Statistics You Need to Know
- 100+ Animation Statistics: The Ultimate Guide To The Industry’s Trends and Insights
- 80+ Franchise Statistics and Facts You Should Know In 2024
- The Future of Learning: 50+ Top EdTech Statistics For 2024
- The Web3 Statistics Report 2024: Trends, Insights, and Predictions
- Meme Statistics 2024: Facts, Trends, and Figures That Will Blow Your Mind
- 85+ MOST Interesting Anime Statistics and Facts (NEW Report)
- Board Game Statistics: Revenue, Market Size, Demographics & More
- 125+ Interesting Airbnb Statistics by Country (Deep Insights)
- 50+ Interesting Born Into Poverty Stay In Poverty Statistics
- 90+ Interesting Film Industry Statistics (NEW Report)
- 80+ Alarming Technology Addiction Statistics You Must Know
- 65+ Impressive Chess Statistics and Facts To Know in 2024
- Spotify Statistics: Latest Report on The Music Streaming Platform
- 50+ Useful Video Game Addiction Statistics, Facts & Huge Trends
- 50+ Vital Internet Safety Statistics & Facts You Must Know
- Internet Dangers Statistics: A Look At The Internet’s Dark Side
- 50 Interesting Bible Statistics and Facts You Didn’t Know
- 95+ Interesting Dream Statistics and Facts You Can’t Miss
- 75+ Interesting Relationship Statistics & Facts You Should Know
- Dance Statistics: A Deep Dive Into The Rhythm Of Movement
- 40+ Incredible Single Father Statistics You Have to Know
- 95+ Jaw-Dropping Period Poverty Statistics You Need To Know
- 70 Exciting Love Statistics And Facts (True Love, Intimacy, Marriage, Dating & Relationships)
- 30+ Gentle Parenting Statistics & Facts: Is This Parenting Style Worth It?
- 55+ Useful Black Consumer Spending Statistics (2024 Report)
- Holiday Spending Statistics: Valentine’s Day, Easter, Thanksgiving, & Christmas

