The year is filled with lots of exciting holidays. And while we look forward to these holidays, the world economy faces a “major adjustment.”
So, how does the economy affect our holiday? To answer that, here are 160 exciting holiday spending statistics.
Yes, I said 160.
This detailed post shows you all you need to know about holiday spending insights.
I covered Valentine’s Day, Easter, Thanksgiving, and Christmas holiday spending statistics. These are significant holidays celebrated worldwide.
So these statistics should give you clear insights into what to expect for this year’s holiday spending.
Key Statistics
- Gen-Z consumers increased their holiday spending by 15%, spending about $1,275
- Americans planned to spend up to $632 on holiday gifting experiences like restaurant meals and concert tickets
- Online holiday spending via mobile devices reached $35.9 billion.
- 60% of consumers will abandon their shopping cart if they see hidden shipping fees while checking out.
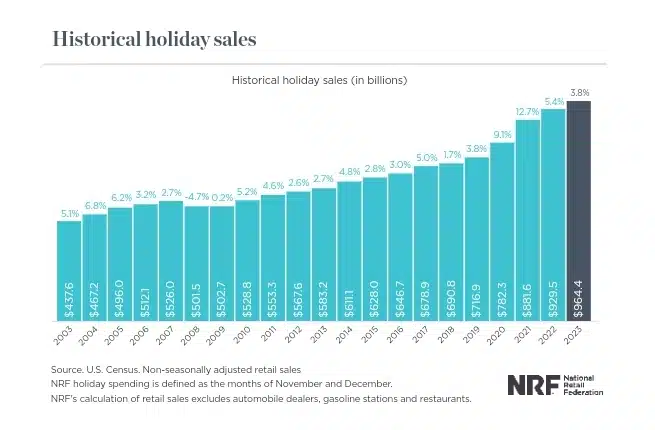
- The total core retail sales for the 2023 holiday season reached $964.4 billion, growing by 3.8%.
- 53% of consumers plan to celebrate Valentine’s Day in 2024.
- Top 3 Valentine’s Day gifts include candy (57%), greeting cards (40%), and flowers (39%).
- Valentine’s Day spending in the United States is expected to total just under $26 billion by 2024.
- Over 58 million pounds of chocolate are bought during the Valentine’s Day sales week
- Easter is the 7th top-selling week for U.S. retail.
- The total spending for Easter in the U.S reached $24 billion
- Easter retail spending in the UK amounted to £1.3 billion.
- 74% of holiday shoppers planned to shop in the 5-day Thanksgiving holiday weekend
- Americans were expected to waste up to 312 million pounds of food during Thanksgiving.
- The average price for a Thanksgiving dinner in the U.S. fell to $61.17 from $64.05 in 2022.
- 46 million turkeys are consumed every Thanksgiving
- 43% of surveyed U.S shoppers say they start their winter holiday shopping in November.
- 75% of the surveyed U.S. holiday travelers planned to use credit cards to fund some of their travel expenses.
- The cost of Christmas in Canada, Germany, and Australia is $1717, $1653, and $1188, respectively.
- Consumers planned to spend more than 60% of their holiday budget online, with the remainder spent in-store.
- Christmas travel expenses increased by 31% in Canada and 12% in the U.S.
General Holiday Spending Statistics
1. Gen-Z consumers increased their holiday spending by 15%, spending about $1,275. (source)
2. Compared to other generations, Gen Z consumers prefer to look for gift ideas in stores (67% vs. 58% overall) and on social media (41% vs. 31%). (source)
They also prefer social media to compare prices (34% vs. 27%) and learn about sustainable businesses (70% vs. 51%). Mobile payment is faster (35% vs. 21%).
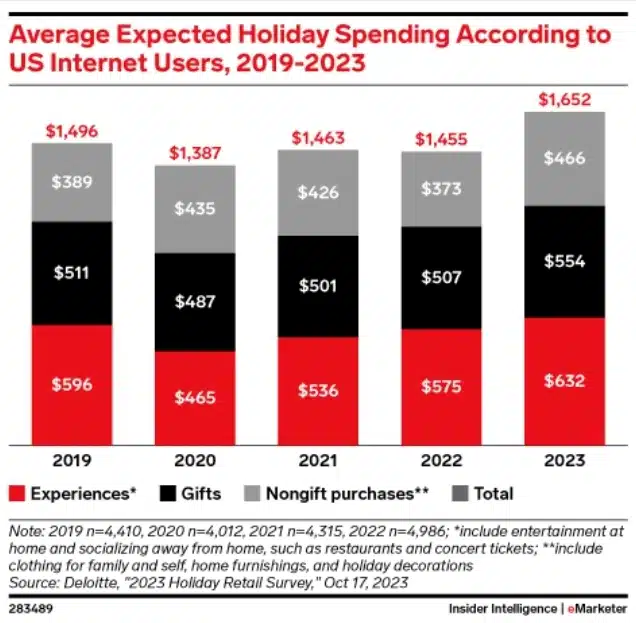
3. Americans planned to spend up to $632 on holiday gifting experiences like restaurant meals and concert tickets. (source)
4. 43% of U.S. shoppers say they planned to spend more on holiday purchases than in 2022. This is primarily due to inflation. (source)
5. According to Deloitte, U.S. internet users will spend an average of $1,652 this holiday season, which is higher than pre-pandemic figures. This represents a 13.5% increase from 2022, when average spending was $1,455. (source)
6. Consumers spent $9.8 billion in the 2023 Black Friday sales. This is a whopping 9.8% increase from the previous year. (source)
7. Middle-income households in the U.S., with an annual salary of $40,000 to $99,999, planned to spend $947 on holiday gifts. (source)
8. Conversely, high-income households planned to spend over $1400. Low-income households planned to spend $429 on average—a decline from $477. (source)
9. Middle-aged adults spend the most on holiday gifts, with an average of $1,111. (source)
10. Households with children planned to spend $1,306 on average, compared to $835 for those without children. (source)
11. The primary reason why people start their winter holiday shopping earlier is to spread out their budget (60%). Other top reasons include to avoid the stress of last-minute shopping (46%) and to avoid crowds (45%). (source)
12. 58% of consumers prefer to shop online during the winter holiday season. 49% say they also prefer departmental stores, 48% prefer discount stores, and 44% prefer grocery stores and supermarkets. (source)
13. Nearly half (48%) of surveyed consumers intend to adjust spending by reducing holiday expenditures. (source)
14. Approximately 62% of consumers intend to pay for holiday expenses with a credit card. This makes credit cards the top payment choice during the holidays. (source)
15. 68% of baby boomers and 64% of Gen Xers plan to utilize credit cards, compared to 44% of Gen Z consumers. (source)
16. Buy now, pay later (BNPL) is more popular among Gen Zers for financing holiday gifts than other demographics. About 39% of Gen Zers will use BNPL during the holidays, compared to only 9% of baby boomers and 21% of Gen X consumers. (source)
17. In 2023, more Gen Zers planned to spend 70% more on gift cards than previous generations. (source)
18. 28% of shoppers plan to use their Paypal reward points to buy gifts, emphasizing another way consumers are trying to save money. (source)
19. According to Adobe, consumers spent $76.8 billion online, attracted by pre-winter-holiday discounts and flexible payment options. (source)
20. Buy Now, Pay Later (BNPL) payment method drove up to $6.4 billion of online spending in October 2023. Between January 2023 and October 2023, BNPL drove over $58.5 billion in online sales. (source)
21. In October 2023, online holiday spending via mobile devices reached $35.9 billion. (source)
22. 59% of holiday shoppers start browsing and shopping for holiday items in early November. (source)
23. In the U.K., 79% of holiday shoppers say they will spend less on non-food-related items. (source)
24. 50% of the winter holiday shopping started in October 2023. (source)
25. 54% of winter holiday shoppers said they expect to feel financially burdened due to the price of items. 33% say they expect inflation to influence their shopping habits. 25% say they are stressed about the cost of holiday shopping. (source)
26. 87% of holiday shoppers plan to use at least one money-saving strategy. For example, 42% of them prefer to purchase fewer items. Another 41% prefer to find more coupon discounts or sales. And 30% prefer to begin their holiday shopping earlier. (source)
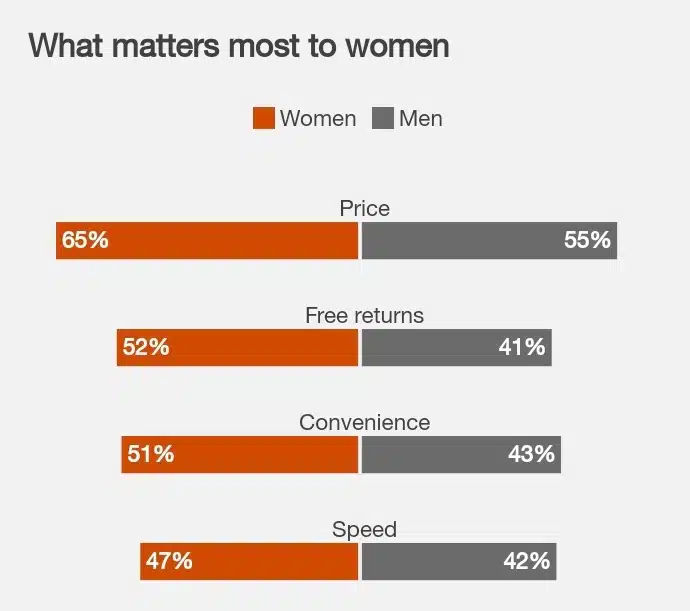
27. Female shoppers were more likely to increase their spending by 11% compared to 2022. The female shoppers are more laser-focused on value than the male shoppers. They are more concerned about price, free returns, convenience, and speed. (source)
28. In 2022, restaurant spending comprised 15% of the October-December holiday period. (source)
29. 95% of people planned to shop for the holiday season in 2023. This is an increase from the 92% of intended holiday shoppers in 2022 and the 88% in 2021. (source)
30. 74% of retail executives expect holiday sales to increase year-over-year. (source)
31. 82% of holiday shoppers planned to shop for non-gift items. (source)
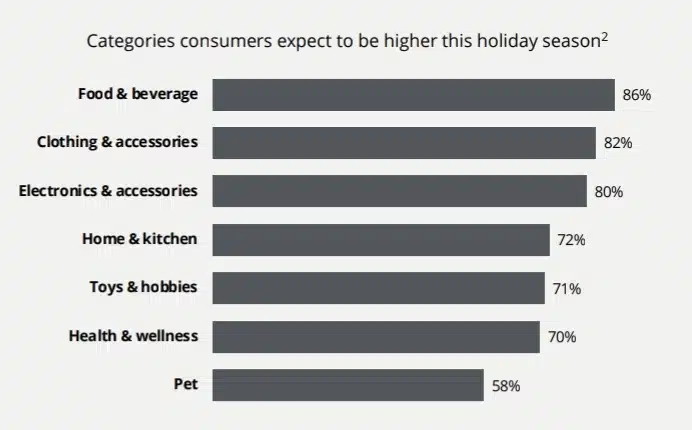
32. 72% of holiday consumers expected higher prices in 2023. 86% of consumers expected prices of food and beverage items to be higher. 82% expected clothes and accessories prices to increase. 80% expected electronics and accessories. (source)
Other categories shoppers expected to increase in price are:
- Home and kitchen (72%)
- Toys and hobbies (71%)
- Health and wellness (70%)
- Pet (58%)
33. 53% of holiday shoppers say they will consider cutting back on self-gifting if their budget becomes too tight. (source)
34. 60% of consumers will abandon their shopping cart if they see hidden shipping fees while checking out. (source)
35. 49% of Gen-Z consumers are concerned about the amount of packaging used in online orders. Hence, retail executives are considering this kind of packaging. As 93% of retail executives prioritize sustainability, 56% actively seek solutions to better and more sustainable packaging options. (source)
36. The top 3 busiest holidays for restaurants are Christmas Day, New Year’s Day, and Mother’s Day. (source)
Other busy holidays include:
- Veterans Day
- Easter Holiday
- Labor Day
- Valentine’s Day
- Game Day
- Presidents’ Day
- Memorial Day
37. The total revenue for the winter holiday season in 2023 was $222.1 billion. The period was between November 1st and December 31st. (source)
38. The total core retail sales for the 2023 holiday season reached $964.4 billion as they grew by 3.8%. (source)
Valentine’s Day Spending Statistics
39. According to NRF, the total 2023 Valentine’s Day spending was expected to reach $25.9 billion. (source)
40. 53% of consumers plan to celebrate Valentine’s Day in 2024. Additionally, 62% of consumers between 25 and 34 plan to celebrate Valentine’s Day this year, more than other age groups. (source)
41. Americans plan to spend over $6.4 billion on jewelry and $2.6 billion on flowers. They also plan to spend $3 billion on clothing and $4.9 billion on a special evening out. (source)
42. Most Valentine’s Day shoppers prefer to shop for gifts online (35%) and in departmental stores (34%). 31% prefer to shop in discount stores, and 18% prefer specialty stores. (source)
43. 32% of surveyed Americans plan to give a gift of experience on Valentine’s Day. (source)
44. Top 3 Valentine’s Day gifts include candy (57%), greeting cards (40%), and flowers (39%). (source)
Other gifts include:
- An evening out (32%)
- Jewelry (22%)
- Gift cards (19%)
- Clothing (21%)
45. During the 7-week Valentine’s Day selling season, candy, mint, and gum (CMG) sales made up to $4.1 billion. In the total CMG sales, chocolate sales accounted for $2.5 billion, and non-chocolate sales accounted for $1.2 billion. (source)
46. In the U.K., one in 4 couples say they are swapping a night out for a night in due to the rising costs of the economy. (source)
47. 89% of Brits celebrating Valentine’s Day are doing so with their romantic partner. However, 13% said they’ll celebrate their platonic relationship. (source)
48. Valentine’s Day spending in the U.K. alone was expected to reach £990 million in 2022, representing a nearly 15% increase over the previous year. (source)
49. One in five women in a UK survey said they would not like to receive a gift card or a lingerie set as a Valentine’s Day gift. Also, a Valentine’s Day card was the most unpopular gift of the year among men, with more than 40% indicating they would be unhappy with such a present. (source)
50. Valentine’s Day spending in the United States is expected to total just under $26 billion by 2024. (source)
51. Additionally, during the 7-week sales period, sales from seasonal Valentine’s Day gifts reached $729 million. (source)
52. Over 58 million pounds of chocolate are bought during the Valentine’s Day sales week. (source)
53. 82% of Americans in a relationship will give their partner a Valentine’s Day gift. (source)
54. According to 31% of Americans in a relationship, spending more than you can afford proves how much you care for your significant other. Additionally, 55% have never set a spending limit for Valentine’s Day. And 47% have never skipped Valentine’s Day celebrations with their partner. (source)
55. About 145 million Valentine’s Day cards are exchanged yearly. This makes it the second-biggest card-sharing holiday. (source)
Easter Spending Statistics
56. 80% of U.S. adults are excited to celebrate Easter. They plan to spend an average of $151 on clothes, candy, cards, or flowers. (source)
57. 48% of people not celebrating Easter desire to participate in Easter sales and discounts. (source)
58. Younger consumers are more likely to make an Easter purchase on their smartphones. (source)
59. Easter is the 7th top-selling week for U.S. retail. (source)
60. 25% of Americans who celebrate Easter and spend on gifts aren’t religious. (source)
61. Egg prices increased by 75% in February 2023. (source)
62. Over 70% of people celebrating Easter prefer to buy food. 50% prefer to buy candy. (source)
63. 51% of those celebrating Easter believe inflation will affect their celebrations. Hence, 58% say they’ll buy items on sale to save money. 37% will save money by using coupons to purchase gifts. 29% say they’ll prepare budget-friendly foods, and 26% say they’ll instead shop at discount stores. (source)
64. In 2023, the total spending for Easter in the U.S. reached $24 billion. (source)
65. U.S. consumers planned to spend $3.3 billion on candy during Easter. (source)
66. Also, U.S. consumers planned to spend an average of $26.31 on candy during Easter. (source)
67. According to 51% of surveyed U.S. consumers, Reese’s peanut butter eggs are the number one and most popular Easter candy. (source)
68. About 40 million Easter cards are sent and exchanged yearly. (source)
69. Americans eat over 16 million jelly beans on Easter. (source)
70. Over 90 million chocolate bunnies are sold every Easter. (source)
71. Easter retail spending in the UK amounted to £1.3 billion. (source)
72. 6.5 million Brits go on Easter trips for the holiday. This brings about a £1.8 billion boost in the U.K. economy. (source)
73. In 2023, UK consumers most likely spent nearly £1 billion on Easter eggs. (source)
74. the UK sells between 80 and 90 million chocolate Easter eggs yearly. (source)
75. About 333 million Crème Eggs are sold yearly in the U.K. (source)
76. 11.5 million Italians travel for the Easter holidays. 8.2 million are adults, and the remaining 3.3 million are children. (source)
77. Over 50% of people celebrating Easter say they will buy decorations. 44% say they will buy Easter flowers. (source)
78. Men plan to spend more than women on Easter. (source)
79. 53% of younger consumers (between 18 and 24 years) planned to travel for the Easter holidays to be with family and friends. (source)
Thanksgiving Spending Statistics
80. 74% of holiday shoppers planned to shop in the 5-day Thanksgiving holiday weekend. (source)
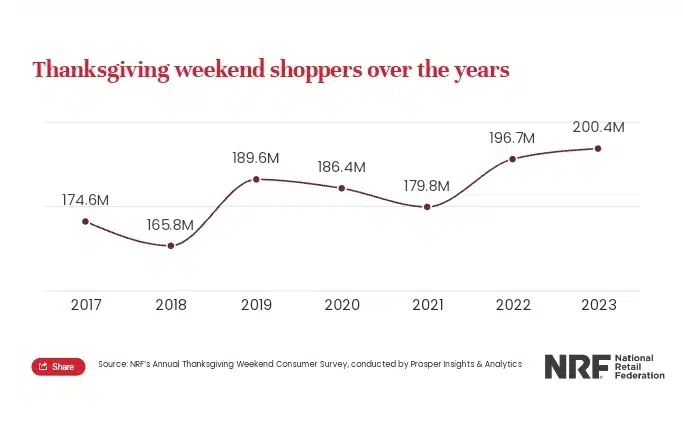
81. Approximately 200.4 million consumers shopped between Thanksgiving Day and Cyber Monday. (source)
82. Between Thanksgiving and Cyber Monday, 121.4 million consumers visited physical retail locations to check out items and make purchases. However, 134.2 million consumers visited online retail stores. (source)
83. In 2023, Americans were expected to waste up to 312 million pounds of food during Thanksgiving. This is approximately $608 million worth of food. (source)
84. Also, roughly 103.6 billion gallons of water were expected to be wasted during Thanksgiving. (source)
85. According to Hallmark, about 16 million Thanksgiving cards are exchanged yearly. Almost 60% of these cards are given to family members and 25% to friends. (source)
86. During Thanksgiving, airplane tickets averaged $286. Also, car rentals for Thanksgiving averaged $42 per day. (source)
87. 25% of people planned to spend between $101 and $200 for 2023 Thanksgiving. However, only 11% and 5% planned to spend above $200 and $300 respectively. (source)
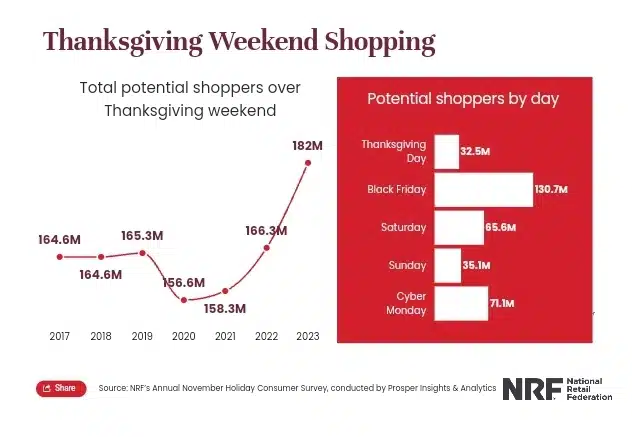
88. According to NRF, about 182 million people planned to shop in-store and online between Thanksgiving and Cyber Monday before the winter holidays. (source)
89. In 2023, the average price for a 16-pound turkey on Thanksgiving in the United States (U.S.) was $27.35. All other ingredients cost between $0.9 and $4.44. The average American consumer pays $3.84 for a dozen dinner rolls. (source)
90. Approximately 75% of Thanksgiving hosts said they would look for stores with the lowest food prices or purchase store-brand products. (source)
91. In the United States, the price of uncooked poultry, such as turkeys, rose by 7.2% in October 2023. The price of this Turkey had risen by 16.9% in 2022. In contrast, the cost of potatoes fell by 3.3% compared to the same period in 2022. (source)
92. In 2023, the average price for a Thanksgiving dinner in the U.S. fell to $61.17 from $64.05 in 2022. (source)
93. In California, a whole 15-pound turkey costs an average of $41.85. (source)
94. To cut high costs during Thanksgiving, two-thirds of consumers planned to buy items on sale. And another 42% planned to use promotional coupons. (source)
95. Approximately 82% of surveyed Thanksgiving dinner hosts in 2022 said they looked for more deals and discounts to compensate for rising grocery prices. Furthermore, 74% of survey respondents said they plan to buy store-brand products. (source)
96. Aside from Turkey, Americans spent $5.6 billion on items such as clothing, electronics, jewellery, and toys on Thanksgiving. (source)
97. It was estimated that up to 293.3 million (88%) Americans ate turkey during Thanksgiving 2023. (source)
98. Americans spent about $1.28 billion on Thanksgiving Turkey. (source)
99. According to the United States Department of Agriculture (USDA), 46 million turkeys are consumed every Thanksgiving. (source)
100. The average American household most likely spent $107.01 on Thanksgiving in 2023. (source)
101. Also, Miami is most likely the highest-spending city for Thanksgiving at $205.40 per household. On the other hand, Alabama is most likely the most generous state for Thanksgiving, spending an average of $176.56 per household. (source)
Christmas Spending Statistics
102. In the 2023 Christmas holiday, over 40% of consumers planned to spend more than they did the previous holiday. (source)
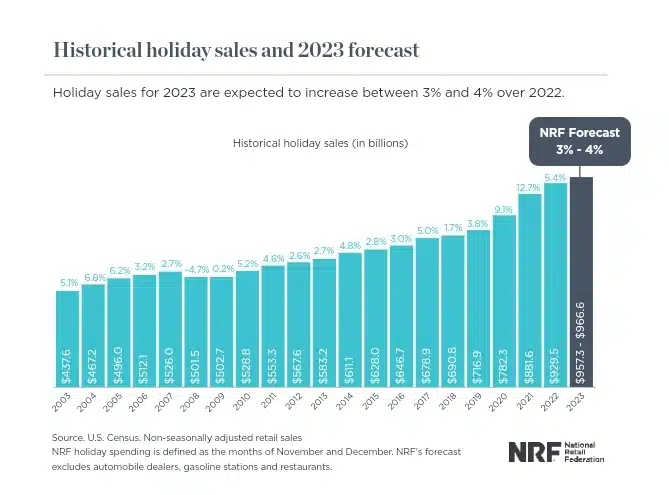
103. According to NRF, the 2023 Christmas and New Year holiday spending was expected to reach between $957.3 billion and $966.6 billion. (source)
104. In a recent report, surveyed U.S. consumers planned to spend up to $875 on average on core holiday items like decorations, gifts, food, etc. This amount is a $42 increase from that of 2022. (source)
105. 92% of U.S. adults also planned to celebrate Christmas, Hanukkah, and Kwanzaa in 2023, compared to 2022. (source)
106. 43% of surveyed U.S shoppers say they start their winter holiday shopping in November. (source)
107. Up to 61% of consumers will continue to shop between December 1 and December 25. (source)
108. 50% (over 130 million) of surveyed U.S adults planned to spend money on flights or hotel lodgings during the holiday season. These holiday travellers plan to spend an average of $1,947 on holiday travel expenses. (source)
109. 21% of holiday travellers have either bought or plan to purchase travel insurance for their holiday travels. (source)
110. 35% say they will maintain their travel plans despite the expense. However, 24% of non-holiday travellers say cost is their primary reason for not travelling. (source)
111. Additionally, 40% of non-travellers say they prefer to spend their holiday at home instead of travelling. (source)
112. 75% of the surveyed U.S. holiday travelers planned to use credit cards to fund some of their travel expenses. (source)
113. According to a survey, the busiest time of the year for restaurants is the winter (Christmas) holidays. 77% prefer restaurants to do their holiday cooking. 57% prefer to eat at a restaurant, and 50% prefer to order takeout or delivery. (source)
114. For the holidays, 49 million people planned to travel by car, and 5 million people planned to travel by flights. (source)
115. In a survey, 83% of Americans said they’d fill their family members’ Christmas stockings with sweets. Some of the sweets include candy, chocolate, and gum. Also, 64% said they’d give the children small toys. And 59% went for lip balm. (source)
116. Americans who intend to decorate budget an average of $384 for holiday decorations. (source)
117. Americans who plan on using professional decorating services will pay an average of $1,023 — almost 4x the cost of self-service. (source)
118. Men will most likely spend more on holiday decorations as they budget an average of $490, while women budget an average of $292. (source)
119. However, airplane tickets for Christmas trips averaged $400 in 2023. And car rentals for Christmas averaged $53 per day. (source)
120. Over 1.3 billion Christmas cards are sent yearly. This makes Christmas the biggest season for sending and exchanging cards. (source)
121. 98% of consumers say they always participate in wrapping presents on Christmas. 90% say they decorate their homes. 88% decorate a Christmas tree, and 85% send letters, cards, and photos. (source)
122. According to World Remit, the cost of Christmas in Canada, Germany, and Australia is $1717, $1653, and $1188, respectively. (source)
123. The cost of Christmas in the USA is $1205. (source)
124. The cost of Christmas in France is $1142. (source)
125. The cost of Christmas 2023 increased in Nigeria by 23.71% compared to 2022. However, in Canada, the cost of Christmas decreased by 17.03% compared to 2022. (source)
126. Clothing is the most popular Christmas category (56%), followed by gift cards (44%) and toys (37%). In the 2023 holiday season, 31% of consumers planned to buy books, video games, and other media. 29% wanted food/candy. Furthermore, 28% of consumers planned to buy personal care and beauty items as gifts, up from roughly one-quarter in previous years. (source)
127. Online searches (44%), friends and family (35%), in-store (32%), and wish lists (26%) continue to be the most popular sources of gift inspiration. (source)
128. The total Christmas gift card spending was estimated to reach $29.3 billion, up from $28.6 billion in 2022. Holiday shoppers intend to buy three to four gift cards and spend an average of $49.43 per card ($166.69 per person). (source)
129. Restaurant gift cards have the highest popularity (30%), followed by bank-issued gift cards (26%), department stores (26%), and coffee shops (21%). (source)
130. In 2023, approximately 58% of consumers in the United States planned to spend roughly the same amount of money on Christmas goods as they had in 2022. (source)
131. Around 25% of American respondents planned to spend less on Christmas, while less than 20% planned to spend more. (source)
132. In 2023, U.S. holiday retail sales totalled just over $950 billion, up approximately $20 billion from the previous year. (source)
133. In a 2023 Christmas survey, 37% of respondents planned to spend more than $150 on Christmas decorations. Another 26% planned to spend up to $100, 7% intended for up to $150. Only 2% planned to spend up to $10, and 5% said they will spend nothing. (source)
134. 70% of surveyed Americans planned to buy ornaments as their decorative item for Christmas. 56% said they’d buy string lights, and 51% wanted to purchase wreaths. (source)
135. 80% of consumers surveyed planned to purchase new holiday decorations. (source)
136. Consumers planned to spend more than 60% of their holiday budget online, with the remainder spent in-store. (source)
137. In 2022, U.S. consumers are expected to spend an average of $920 on Christmas gifts. This is a slight decrease from 2021. (source)
138. Over half of American consumers planned to purchase gift cards or certificates for others. As it is a trendy gifting option, it’s also very convenient. (source)
139. According to a report, Pork dishes are the most popular Christmas celebration dish, especially in 23 countries. (source)
140. However, in the U.S., roast turkey is the most popular Christmas dish. (source)
141. In Southeast Asia, about 60% of surveyed consumers planned to increase their online spending for the Christmas holidays. (source)
142. 53% of consumers from Great Britain said they are not worried about Christmas expenses. (source)
143. In 2023, Aldi was the UK’s cheapest place to buy Christmas dinner. Aldi’s Christmas dinner ingredients cost an average of £33.80, with Lidl following closely behind at £33.84. (source)
144. Most UK consumers planned to eat roast potatoes as part of their Christmas dinner. This makes roast potatoes the most popular Christmas celebration dish in the UK. However, turkey is the most popular meat, as over 62% of consumers planned to eat it during Christmas. (source)
145. A four-person turkey meal cost 11.16% more in 2023 than the previous year. (source)
146. Almost 25% of people said they would pay $200 or more for a real Christmas tree. (source)
147. In 2021, 36% of Americans incurred holiday debt, averaging $1,249. (source)
148. In 2022, the number increased as 40% intended to go into debt to pay for Christmas holiday gifts and travel expenses. (source)
149. People feel the same about the holidays as they do every year. Most (59%) say their excitement for the holidays is the same as the previous year. However, 20% said they were more excited than the previous year. And 21.7% admitted less enthusiasm. (source)
150. 64% of European consumers planned to shop secondhand for the 2023 Christmas season. (source)
151. The main reasons consumers considered purchasing second-hand items are a desire to save money (47%) and a desire to shop more sustainably (37%). (source)
152. Two-thirds of consumers say they received a brand-new Christmas gift they didn’t use or like. Fortunately, only 6% said they threw away unwanted gifts. (source)
153. While 28% kept items they knew they would never use, less than a quarter (23%) sold unwanted items online. (source)
154. In Canada, the average amount each consumer most likely spent on Christmas was $1,635. This is a 13% increase from the average amount in 2022. (source)
155. Christmas travel expenses were up by 31% in Canada and 12% in the U.S. This is unsurprising as Canada is experiencing high inflation and a harsh economic outlook. (source)
156. As Canadian consumers seek better customer experiences, 87% say they seek convenience. 85% look for delivery speed, and 63% are loyal to their preferred brands. (source)
157. 61% of shoppers in Canada say they prefer to visit the physical store to discover possible Christmas gift items. (source)
158. 43% of Canadian shoppers believe knowledgeable in-store employees are a primary source of product recommendations. (source)
159. However, technology is also essential in Christmas retail shopping. 25% of Gen Z and Millennial consumers plan to shop for the holidays using technologies like virtual and augmented reality, the metaverse, and artificial intelligence (AI). (source)
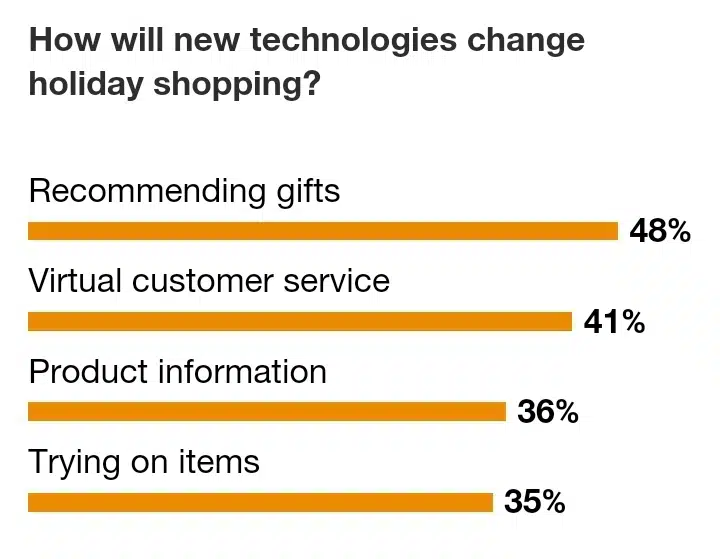
160. For shoppers, these technologies assist in gift recommendations (48%,) offering virtual customer service (41%) and product information (36%) and trying on items (35%). (source)
FAQs on Holiday Spending Statistics
1. How Much Do People Spend During the Holidays?
According to a recent Gallup report, Americans spend an average of $975 on holiday gifts.
2. How Much Does the Average U.K. Person Spend on Holidays?
A 9-night holiday abroad now costs an average of £1,094 per person. Holidaymakers spend the most on food, drink, and entertainment, totalling £637. On average, tourists spent an additional £317 on lodging and £457 on flights.
3. What are the Three Biggest Holidays in the U.S?
According to a recent survey, Thanksgiving is the most popular holiday in the U.S., with a popularity rating of 79%. Memorial Day and Christmas tie for second place, with a popularity rating of 78%.
Related Posts:
- Thought-Provoking Gender Inequality Statistics: 160+ Insights Across Regions
- 110+ Shocking Income Inequality Data You Need to Know
- 50 Interesting Sharing Economy Statistics You Need to Know
- 100+ Animation Statistics: The Ultimate Guide To The Industry’s Trends and Insights
- 80+ Franchise Statistics and Facts You Should Know In 2024
- The Future of Learning: 50+ Top EdTech Statistics For 2024
- The Web3 Statistics Report 2024: Trends, Insights, and Predictions
- Meme Statistics 2024: Facts, Trends, and Figures That Will Blow Your Mind
- 85+ MOST Interesting Anime Statistics and Facts (NEW Report)
- Board Game Statistics: Revenue, Market Size, Demographics & More
- 125+ Interesting Airbnb Statistics by Country (Deep Insights)
- 50+ Interesting Born Into Poverty Stay In Poverty Statistics
- 90+ Interesting Film Industry Statistics (NEW Report)
- 80+ Alarming Technology Addiction Statistics You Must Know
- 65+ Impressive Chess Statistics and Facts To Know in 2024
- Spotify Statistics: Latest Report on The Music Streaming Platform
- 50+ Useful Video Game Addiction Statistics, Facts & Huge Trends
- 50+ Vital Internet Safety Statistics & Facts You Must Know
- Internet Dangers Statistics: A Look At The Internet’s Dark Side
- 50 Interesting Bible Statistics and Facts You Didn’t Know
- 95+ Interesting Dream Statistics and Facts You Can’t Miss
- 75+ Interesting Relationship Statistics & Facts You Should Know
- Dance Statistics: A Deep Dive Into The Rhythm Of Movement
- 40+ Incredible Single Father Statistics You Have to Know
- The Battle of the Sexes: Male Vs. Female Spending Statistics
- 95+ Jaw-Dropping Period Poverty Statistics You Need To Know
- 70 Love Statistics & Facts (True Love, Intimacy, Marriage, Dating & Relationships)
- 30+ Gentle Parenting Statistics & Facts: Is This Parenting Style Worth It?
- 55+ Useful Black Consumer Spending Statistics (2024 Report)

