Poverty is a complex and multidimensional problem that affects millions of people globally.
One of the most alarming features of poverty is its ability to reproduce itself, with people born into it frequently failing to escape its clutches.
According to the World Bank, around 700 million people live today in extreme poverty. They subsist on less than $2.15 per day, the extreme poverty line.
These born-into-poverty stay-poverty statistics offer an unsettling image, but they also highlight the need to recognize and solve the issues that contribute to the cycle of poverty.
Key Statistics (Editor’s Pick)
- About 700 million people currently live in extreme poverty.
- 10% of children live in constant poverty.
- Of children born into poverty, nearly half (49%) remain in poverty for the rest of their lives.
- In the United States, 16% of all children, or 11.6 million, live in poverty.
- In the United States, almost one-third of poor children will become poor adults.
- In Australia, 1.2 million children and young people are living in poverty.
- Approximately two-thirds of the 237 million children living in extreme poverty in Sub-Saharan Africa.
- An estimated 6.4% of children born into poverty spend their entire lives in poverty.
- 73% of the one in every six children living in poverty were children of colour.
General Born Into Poverty Stay In Poverty Statistics
1. According to the World Bank, around 700 million people currently live in extreme poverty. They live on less than $2.15 per day, which is the extreme poverty threshold. (source)
2. Approximately 51% of workers make less than $35,000 per year. This is only slightly higher than the federal poverty level for a family of four. (source)
3. About 333 million children are living in extreme poverty worldwide. (source)
4. Approximately one in every two children lives in extreme poverty. (source)
5. In 2020, the official poverty rate increased by 1.0 percentage points from 2019 to 11.4%. After five years of annual decreases. (source)
6. Between 2019 and 2020, poverty rates rose for married-couple households and families with a female householder. (source)
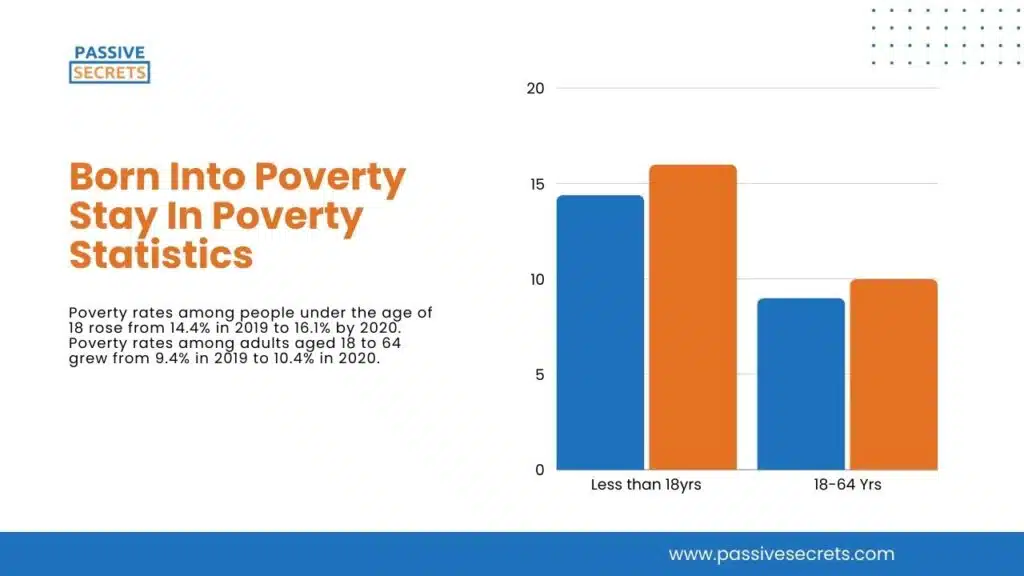
7. Poverty rates among people under the age of 18 rose from 14.4% in 2019 to 16.1% by 2020. Poverty rates among adults aged 18 to 64 grew from 9.4% in 2019 to 10.4% in 2020. (source)
8. 10% of children live in constant poverty. This indicates that they live in poverty for 9 to 18 years, or at least half of their childhood. (source)
9. In 2022, the child poverty rate for American Indian children was 25.9%, 19.5% for Hispanic children, 17.8% for Black children, 11.2% for White children, and 9.9% for Asian children. (source)
10. Between the ages of 1 and 15, the majority of children (65%) do not experience poverty. (source)
11. Of children born into poverty, nearly half (49%) remain in poverty for the rest of their lives. (source)
12. The United States ranks as one of the worst in child poverty rates among the Organization for Economic Cooperation and Development’s 37 member countries. (source)
13. Children who identify as Black, Hispanic, American Indian, or Alaskan Native (AIAN) have the highest rates of poverty. (source)
14. More than four out of every ten children live in a household that is struggling to cover basic needs. (source)
While 7 million to 11 million youngsters are unable to eat enough due to financial constraints.
15. When adopting the SPM, which includes non-cash benefits from government programs and evaluates poverty more fully, the child poverty rate in America is 12.5%. (source)
16. Children of colour in most racial categories are more likely to be poor than their white counterparts. (source)
17. Over one-third of children residing in households headed by single women are poor, with a percentage of 36.4%. Whereas 6.4% of kids from homes with married couples do. (source)
18. In 2020, there were more uninsured under-19 children living in poverty than there were in 2018. Children under the age of 19 living in poverty now have uninsured rates of 9.3%, up 1.6 percentage points. (source)
19. According to a 2018 study, child poverty costs the US economy somewhat more than $1 trillion per year or 5.4 per cent of total GDP. (source)
20. A child born into a poor household today will take four to five generations to attain the national average income level. (source)
21. The COVID-19 epidemic has increased the number of children living in multidimensional poverty by nearly 1.2 billion. (source)
Other Born Into Poverty Stay In Poverty Statistics By Region
22. In the United States, 16% of all children, or 11.6 million, live in poverty. (source)
23. A four-person household with an annual income of less than $29,678 is considered poor. (source)
24. The official poverty rate in the United States for 2022 was 11.5%, with 37.9 million people living in poverty. (source)
25. In 2020, 37.2 million people were living in poverty in the U.S., almost 3.3 million more than in 2019. (source)
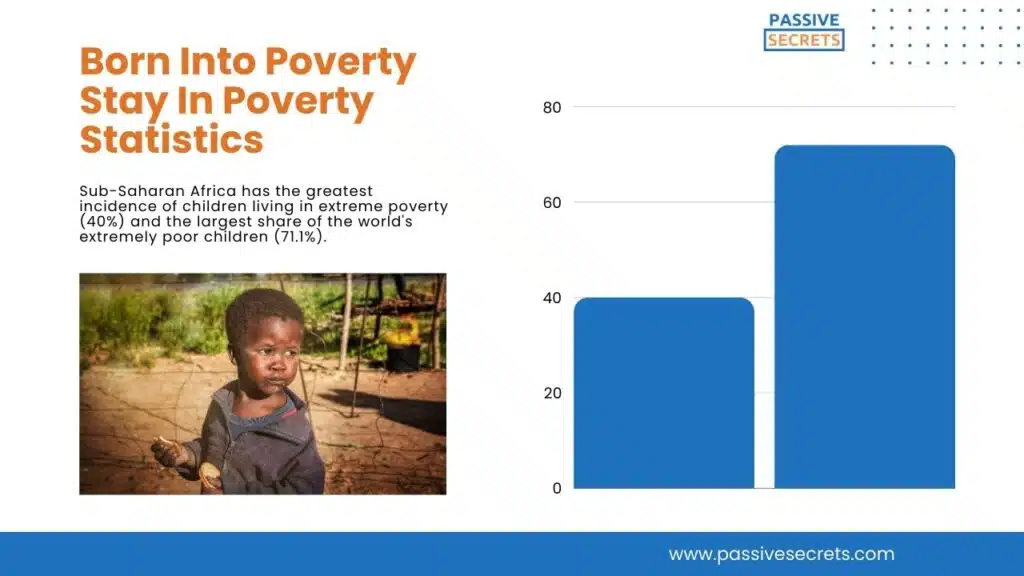
26. Sub-Saharan Africa has the greatest incidence of children living in extreme poverty (40%) and the largest share of the world’s extremely poor children (71.1%). (source)
27. Child poverty in the U.S. has more than doubled, rising from 5.2% in 2021 to 12.4% in 2022. (source)
28. In the UK, 45% of all children in poverty lived in families where the youngest child was under the age of five. (source)
29. In 2021-2022, 350,000 more children fell into relative poverty (after housing costs). This means that 4.2 million children (29% of all UK children) lived in poverty. (source)
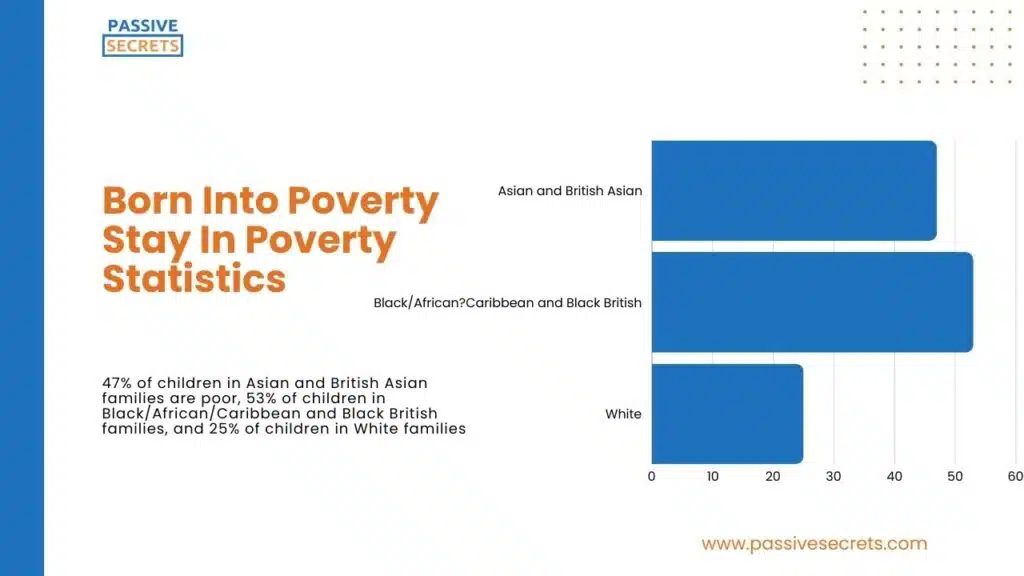
30. 47% of children in Asian and British Asian families are poor, 53% of children in Black/African/Caribbean and Black British families, and 25% of children in White families. (source)
31. In the United States, almost one-third of poor children will become poor adults. (source)
32. In 2018, 13.6% of the Australian population lived in poverty, which amounted to more than 3.24 million individuals. This includes 774,000 children under the age of 15. (source)
33. Children who grew up in impoverished households are 3.3 times more likely to be in poverty in adulthood than those who grew up in never-poor households. (source)
34. After accounting for housing costs, one in six children (16.6%) and more than one in eight adults (13.4%) were living below the poverty level. (source)
761,000 children and nearly three million (3,319,000) persons were living in poverty.
35. In 2019-20, the majority of households receiving Newstart Allowance/JobSeeker Payment or Parenting Payment were in poverty. (source)
36. In 2019-20, almost 60% of households with an unemployed main income earner lived in poverty. However, with COVID-19 income subsidies, this figure decreased by one-third. (source)
37. Only over 60% of young people growing up in poverty finish Year 12, compared to 90% of those from higher socioeconomic situations. (source)
38. In Australia, 1.2 million children and young people are living in poverty. (source)
39. In 2013, around 210 million children in Sub-Saharan African countries experienced acute monetary poverty. By 2022, this figure had increased to a little over 237 million. (source)
40. Seven Sub-Saharan African nations are expected to have over 10 million children living in extreme poverty. Nigeria and the Democratic Republic of the Congo account for nearly 70 million. (source)
41. Approximately two-thirds of the 237 million children living in extreme poverty in Sub-Saharan Africa are under the age of ten. (source)
Poverty From Childhood To Adulthood Statistics
42. According to studies, it is more difficult for poor children to escape poverty as adults. (source)
43. According to a study, 23% of children who spent at least half of their childhood in poverty attended postsecondary education by the age of 25. (source)
This is 23% compared to 70% of children who were never poor.
44. Just 16% of children who spent half of their childhood in poverty were either working or attending school and were generally out of poverty by their late 20s. (source)
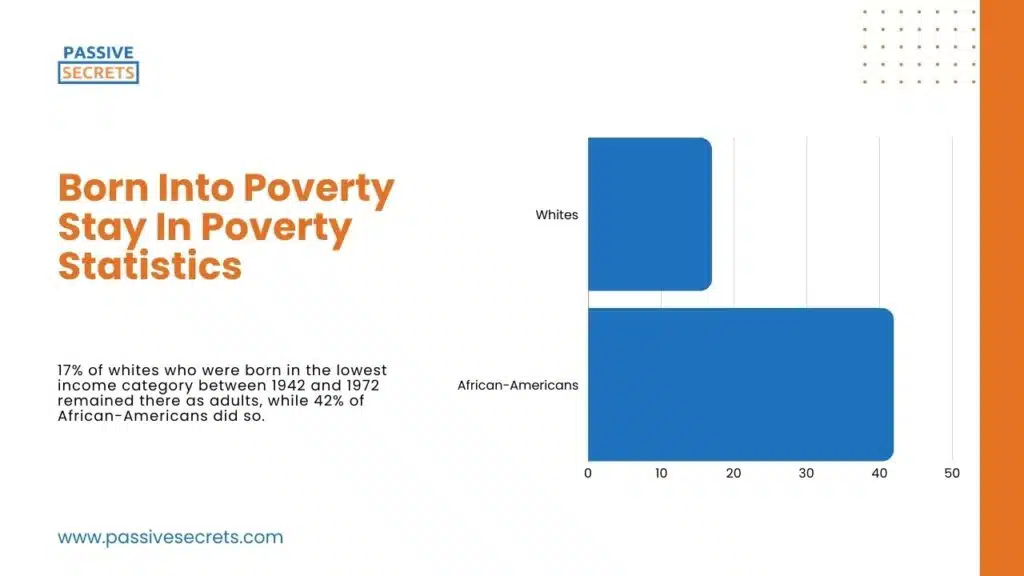
45. 17% of whites who were born in the lowest income category between 1942 and 1972 remained there as adults, while 42% of African-Americans did so. (source)
46. An estimated 6.4% of children born into poverty spend their entire lives in poverty. (source)
47. A recent study on intergenerational poverty found that children who live in poverty are more likely to be disadvantaged as adults. (source)
48. Children who grow up in poverty are more likely to experience poverty as adults, and the likelihood increases with the number of years spent in poverty as a child. (source)
49. Over 5% of adults who never faced childhood poverty were poor at ages 20 and 25. (source)
This percentage increased to about 13% for those in poverty for 1 to 7 years as children.
50. The same study shows that individuals who experienced 8 to 14 years of childhood poverty had 46% being poor at age 20 and 40% at age 25. (source)
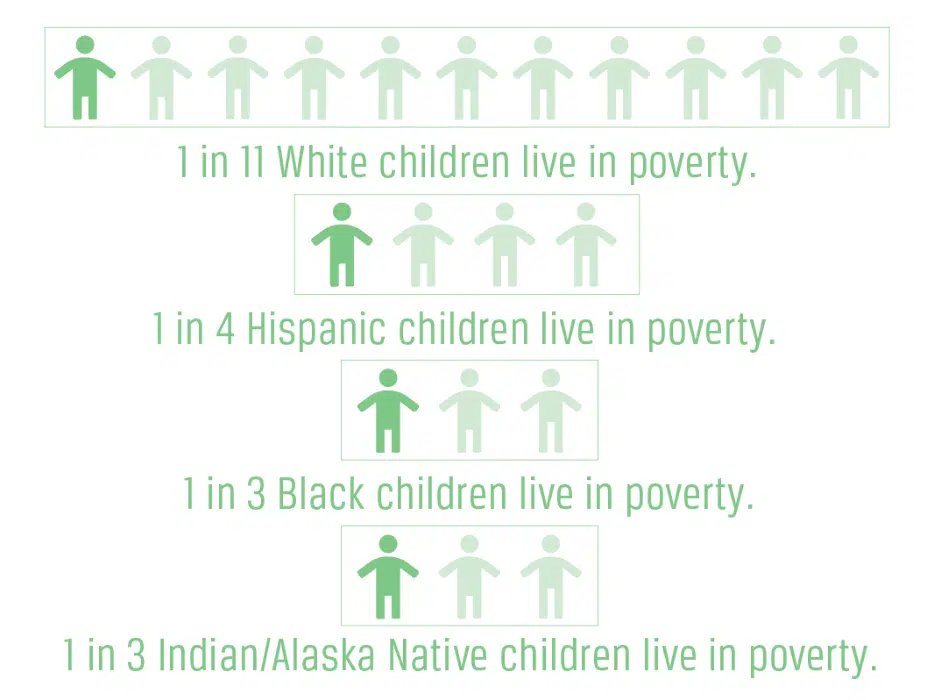
51. In 2020, 73% of the one in every six children living in poverty were children of colour. (source)
One in every 11 White children is poor, compared to one in every three Black or American Indian/Alaska Native children and one in every four Hispanic children.
52. According to one study, a Black child is four times more likely to spend his or her entire life in poverty than a child of another race. (source)
Furthermore, 77% of all Black children are impoverished before reaching adolescence, with 69% living in poverty for nine or more years.
Conclusion
Children born into poverty face significant barriers to escaping it later in life. According to the data, around 700 million people globally live in extreme poverty on less than $2.15 per day
This early exposure to poverty has long-lasting consequences. Studies show that nearly half (49%) of children born into poverty will remain poor as adults.
Compared to those who were never poor as children, they are 3.3 times more likely to be poor and 2.5 times more likely to experience financial stress as young adults.
Overall, these statistics demonstrate the entrenched, intergenerational nature of poverty.
Escaping the cycle is extremely difficult, underscoring the need for policies and programs that provide comprehensive support to families and children in poverty.
FAQs
1. What are the chances of being born into poverty?
The chances of being born into poverty vary significantly. According to the United Nations, approximately one in five children worldwide live in extreme poverty, defined as living on less than $1.90 per day. u003cbru003eHowever, this figure can be much higher in developing countries, with rates reaching up to 70% in some regions. Also, American babies born into poor families are likely to remain poor for at least half of their childhoods.
2. How many people are born into poverty?
About 13% of all children are born poor, with 40% of black children and 8% of white children being born into poverty. Specifically, 49% of American babies born into poor families will be poor for at least half of their childhoods.
3. What is the percentage of people living in poverty?
The percentage of people living in poverty varies globally. About 9.2% of the world’s population, approximately 719 million people, live on less than $2.15 a day. In the United States, 11.6% of the population, which is around 37.9 million people, lived in poverty as of 2021 In Nigeria, 40.1% of the total population was classified as poor, with over 82.9 million Nigerians considered poor by national standards.
4. What are the effects of being born into poverty?
Children born to poor parents are more likely to be born underweight and die within their first year of life. They are also more likely to develop asthma and other childhood disorders. Children who grow up in poverty may develop ill health later in life.
Related Posts:
- Thought-Provoking Gender Inequality Statistics: 160+ Insights Across Regions
- 110+ Shocking Income Inequality Data You Need to Know
- 50 Interesting Sharing Economy Statistics You Need to Know
- 100+ Animation Statistics: The Ultimate Guide To The Industry’s Trends and Insights
- 80+ Franchise Statistics and Facts You Should Know In 2024
- The Future of Learning: 50+ Top EdTech Statistics For 2024
- The Web3 Statistics Report 2024: Trends, Insights, and Predictions
- Meme Statistics 2024: Facts, Trends, and Figures That Will Blow Your Mind
- 85+ MOST Interesting Anime Statistics and Facts (NEW Report)
- Board Game Statistics: Revenue, Market Size, Demographics & More
- 125+ Interesting Airbnb Statistics by Country (Deep Insights)
- 90+ Interesting Film Industry Statistics (NEW Report)
- 80+ Alarming Technology Addiction Statistics You Must Know
- 65+ Impressive Chess Statistics and Facts To Know in 2024
- Spotify Statistics: Latest Report on The Music Streaming Platform
- 50+ Useful Video Game Addiction Statistics, Facts & Huge Trends
- 50+ Vital Internet Safety Statistics & Facts You Must Know
- Internet Dangers Statistics: A Look At The Internet’s Dark Side
- 50 Interesting Bible Statistics and Facts You Didn’t Know
- 95+ Interesting Dream Statistics and Facts You Can’t Miss
- 75+ Interesting Relationship Statistics & Facts You Should Know
- Dance Statistics: A Deep Dive Into The Rhythm Of Movement
- 40+ Incredible Single Father Statistics You Have to Know
- The Battle of the Sexes: Male Vs. Female Spending Statistics
- 95+ Jaw-Dropping Period Poverty Statistics You Need To Know
- 70 Exciting Love Statistics And Facts (True Love, Intimacy, Marriage, Dating & Relationships)
- 30+ Gentle Parenting Statistics & Facts: Is This Parenting Style Worth It?
- 55+ Useful Black Consumer Spending Statistics (2024 Report)
- Holiday Spending Statistics: Valentine’s Day, Easter, Thanksgiving, & Christmas

