
The Airbnb vs hotels debate isn’t what it was 7 years ago. Hidden fees, dynamic pricing algorithms, and shifting traveler preferences have completely rewritten the rules.
Yet most people are still making booking decisions based on outdated assumptions.
Here’s what changed: Hotels slashed prices to compete. Airbnb added layers of fees that rival airline pricing complexity. Business travelers discovered short-term rentals. Families realized hotels got cheaper.
And the $1.1 trillion hospitality industry quietly transformed while you were scrolling through listings.
The travelers winning this game—the ones getting better experiences for less money—aren’t just comparing nightly rates. They’re reading signals most people miss: occupancy trends, regional pricing patterns, amenity cost breakdowns, and booking behavior data that reveal when each option actually makes sense.
This guide hands you 36 statistics that will change how you book travel forever.
Key Airbnb vs Hotels Statistics (Editor’s Pick)
- Hotels taxes & spending: Hotels generated $85.1B in taxes in 2025 (up $1.7B from 2024); guest spending is expected to reach $805B in 2026.
- Airbnb workforce: As of December 2025, Airbnb had 8,200 employees and ~13,000 third-party workers, totaling ~21,200 staff.
- Global hotels market: Valued at $2,080.57B in 2025, projected to grow to $3,931.42B by 2034 at 7.54% CAGR; Europe dominated with 36% market share.
- Vacation rentals market: Global market at $97.85B in 2025, expected to reach $138.74B by 2035 at 3.55% CAGR; homes dominated with 49% of accommodation types; Europe led with 34% market share.
- Airbnb listings: Over 9 million active listings globally in 2025, growing alongside Nights and Seats Booked.
- Occupancy rates: U.S. hotels had 62.3% occupancy in 2025 (down from 63% in 2024); Airbnb averaged 39% occupancy in early 2026.
- Airbnb bookings: In 2025, Airbnb recorded over 533 million bookings, covering nights and experiences.
Airbnb vs Hotels Market Share and Industry Growth Statistics
1. Hotels generated $85.1 billion in taxes in 2025, up $1.7 billion from 2024, and are projected to hit $87 billion in 2026. Guest spending’s expected to reach $805 billion in 2026, 1.7% higher than in 2025 (Ahla).
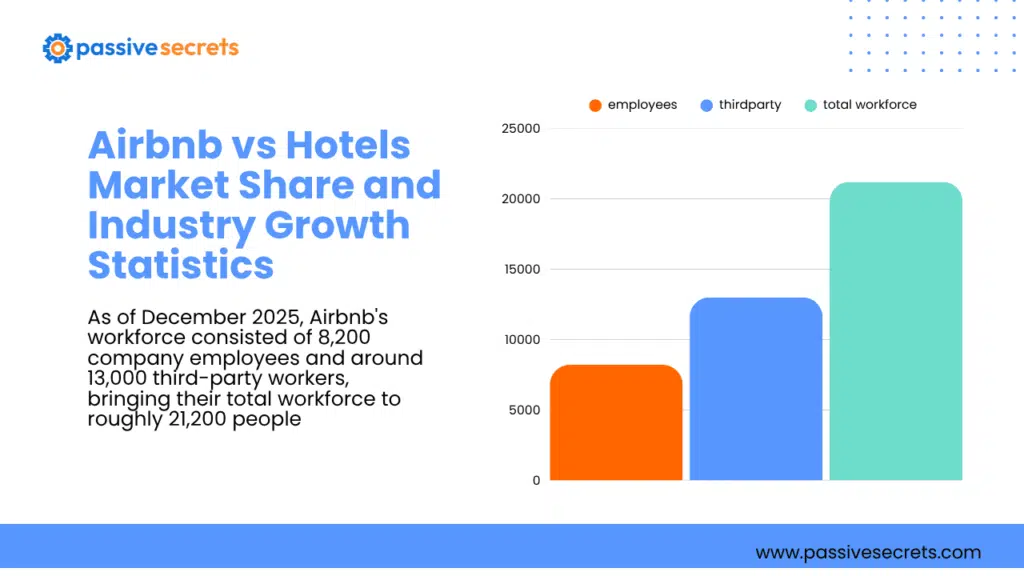
2. As of December 2025, Airbnb’s workforce consisted of 8,200 company employees and around 13,000 third-party workers, bringing their total workforce to roughly 21,200 people (Statista).
3. The global vacation rental market was $97.85 billion in 2025 and is expected to grow to $138.74 billion by 2035 at a 3.55% CAGR. Europe led with 34% market share in 2025, while homes dominated accommodation types with 49% share (Precedence Research).
4. Rental demand remains historically high, capturing about 13% of all accommodations in 2022, up from 9.7% in 2018 (AirDNA).
5. The global hotels market was valued at $2,080.57 billion in 2025 and is projected to grow from $2,197.80 billion in 2026 to $3,931.42 billion by 2034, at a 7.54% CAGR. Europe dominated the market in 2025 with a 36.04% share. Europe led the hotels market in 2024 ($718.84 billion) and 2025 ($749.84 billion). Key contributors in 2025 included Germany ($142.62 billion), the UK ($120.12 billion), and France ($114.52 billion) (Fortune Business Insights).
6. The hospitality market grew from $5.52 trillion in 2025 to $5.82 trillion in 2026 (5.5% CAGR). Driven by tourism, hotel expansion, travel demand, and urbanization, it’s expected to hit $7.47 trillion by 2030 (6.4% CAGR) (Research and Markets).
7. The short-term vacation rental market grew from $131.03 billion in 2025 to $142.55 billion in 2026 (8.8% CAGR), and is expected to hit $199 billion by 2030 (8.7% CAGR) (Research and Markets 2).
8. Airbnb wrapped up 2025 with over 9 million active listings globally, growing in line with Nights and Seats Booked growth (Airbnb 2025 Shareholders Letter).
9. Airbnb’s global market capitalization was $83.76 billion in December 2025, slightly up from $83.34 billion the previous year. The company hit its peak market cap in 2021, exceeding $100 billion (Statista).
10. Airbnb pulled in $2.8 billion in Q4 2025 revenue, up 12% year-over-year, driven by strong nights stayed growth and a moderate Average Daily Rate (ADR) bump (Airbnb 2025 Shareholders Letter).
11. Airbnb’s net worth as of March 04, 2026, is $74.7 billion, a significant reduction from the $93.05 billion it was worth in May 2024 (Macro Trends).
12. Airbnb expects Q1 2026 revenue of $2.59 billion – $2.63 billion, up 14-16% year-over-year, with a slight increase in implied take rate. Foreign exchange is expected to boost growth by about 3 points, thanks to hedging (Airbnb).
13. The average target price for Airbnb stock in the market for the year 2027 stands at $151.49. The highest price target reaches $210.00, while the lowest price target sits at $108.07. Airbnb appears well positioned for a phase of renewed growth, offering potential upside of 30% to 40% over the next several years, provided that the company continues to deliver strong execution (Stocksguide).
Airbnb vs Hotels Booking Trends and Occupancy Rates
14. The occupancy rate of hotels in the United States stood at 62.3 percent as of September 2025. This represented a decline compared to the previous year’s occupancy rate, which had reached 63 percent (Statista).
15. According to a 2025 study, Ferrara emerged as the Italian city that recorded the highest average occupancy rate for four-star hotels during the month of May 2025, achieving an average occupancy rate of 85.3 percent. In contrast, Venice stood out as one of the most expensive Italian cities in terms of the average price for four-star hotels in June 2025 (Statista).
16. The average Airbnb occupancy rate in the United States, as of early 2026, stood at 39% (Rabbu).
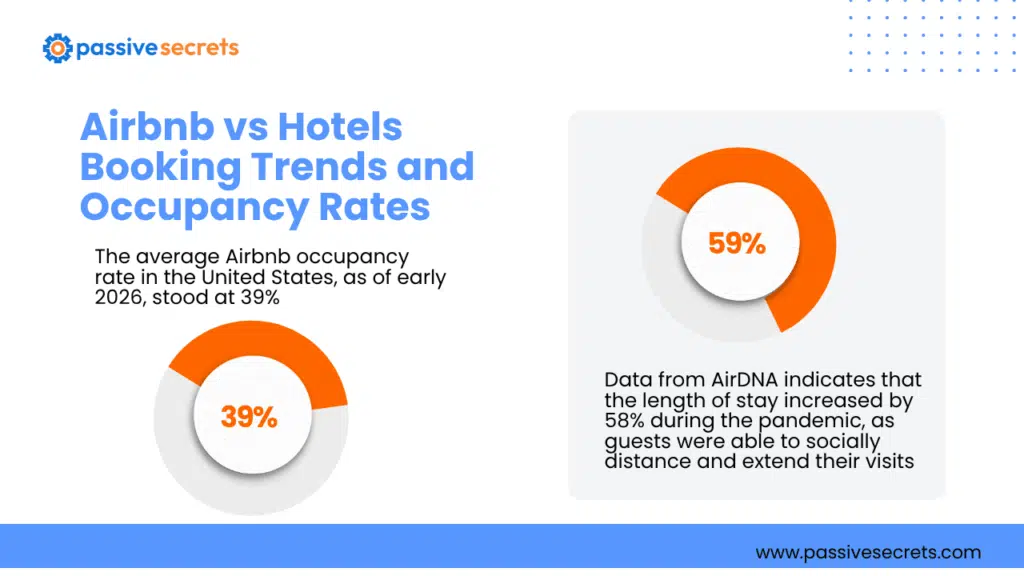
17. Data from AirDNA indicates that the length of stay increased by 58% during the pandemic, as guests were able to socially distance and extend their visits (Airdna).
18. In 2025, Airbnb saw over 533 million bookings, covering nights and experiences (Statista).
19. In 2025, Airbnb bookings in North America averaged 4.1 nights, the highest among all regions that year (Statista).
General Airbnb and Hotel Statistics
20. The hospitality industry’s going tech-heavy – nearly all hoteliers plan to boost IT budgets in the next year, with 67% expecting at least a 10% increase. Only 4% plan to decrease IT budgets, so it’s clear tech’s a priority (Canary Technologies).
21. Hoteliers are focusing on four key areas to drive their tech investments: improving guest experience (52%), boosting operational efficiencies (52%), driving revenue growth (51%), and cutting costs (45%). These priorities are shaping their IT spending plans (Canary Technologies).
22. AI’s gaining traction in hospitality – 51% of hoteliers are already piloting or have adopted it, while 44% are interested or exploring. Expect more to jump on board, with 82% planning to boost AI adoption in the next 12 months (Canary Technologies).
23. Luxury hotels lead in AI adoption (23% broad adoption), followed by upscale hotels (57% using AI). Both plan to accelerate AI use. Economy-class hotels lag behind, with only 32% reporting AI adoption (Canary Technologies).
24. Millennials are 57% more likely to be swayed by hotel tech. 70% of guests find chatbots helpful for simple questions, with 39% willing to use them to get Wi-Fi passwords (Hotel Tech Report).
25. Based on FIFA’s projections and accommodation trends, Airbnb expects 1.7 million extra guest nights over the next five years, with visitors spending around $495 million. This could trigger $1.5 billion in turnover, $814 million in value added, support 14,550 jobs, and generate $78 million in product taxes (Deloitte).
26. Airbnb guests are expected to contribute 2.7 million guest nights in North America during the FIFA World Cup 2026 tournament, with direct spending of around $1.2 billion ($865m USA, $169m Mexico, $177m Canada). In turn, hosts are projected to earn $212 million ($156m USA, $25m Mexico, $31m Canada) (Deloitte).
27. Total spending by Airbnb guests is estimated to generate approximately USD 3.6 billion in total turnover for the North American economies in relation to the FIFA World Cup 2026 tournament. This economic activity represents around USD 2.0 billion in value added and supports an estimated 34,770 full-time equivalent jobs over the course of 2026. Additionally, the associated tax-on-product revenue is anticipated to reach approximately USD 192 million (Deloitte).
28. As of 2025–2026, Airbnb’s platform is active in more than 220 countries and regions worldwide. Airbnb’s supply is not only in large cities—hosts in more than 100,000 cities and towns have made properties available for short-term stays.
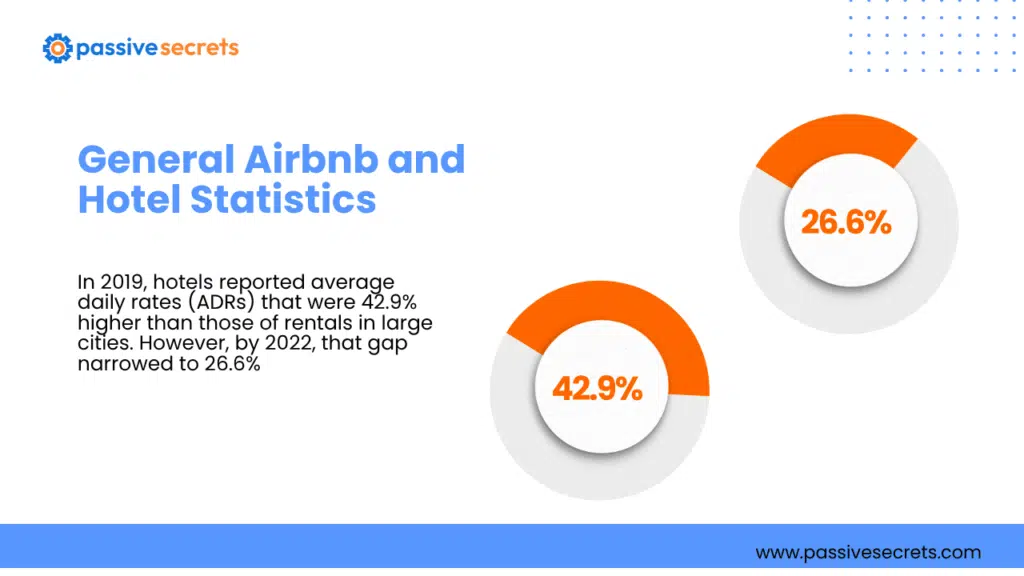
29. In 2019, hotels reported average daily rates (ADRs) that were 42.9% higher than those of rentals in large cities. However, by 2022, that gap narrowed to 26.6% (Airdna).
30. Hotels account for just under 2% of Airbnb and HomeAway listings in the U.S., though that percentage is expected to increase (Airdna).
31. Airbnb’s a major player in online travel, with 5 million hosts and 2.5 billion guest arrivals as of 2025. EMEA led in bookings (215 million), but North America generated the most revenue for Airbnb that year (Statista).
32. Airbnb’s Q4 2025 financials show revenue growth at 10.26%, with EPS down 1.95%. Gross margin’s strong at 82.96%, but operating margin dipped to 20.78%. Bright spot: free cash flow jumped 54.43%, showing solid cash generation amidst some profit challenges (Finance Yahoo).
33. Gen Z is the leading group that prefers Airbnb, with 21% reporting they use it most often. In comparison, a significant majority of Gen X favors hotels, with 74% opting to book hotel rooms (Savanta).
34. Millennials consider hotels more convenient than other lodging options, with 54% preferring hotels over rental properties (Savanta).
35. More than 40% of Millennials feel safest in hotels compared to other lodging options (Savanta).
36. Around 30% of Millennials are likely to choose Airbnb over other lodging options solely due to its convenience (Savanta).
Airbnb vs Hotels Statistics: The Head-to-Head Comparison
Statistics only help when you line them up side by side. So let’s put Airbnb and hotels in the ring together on the metrics that actually decide where you sleep tonight.
1. Price: the gap is closing fast
Airbnb’s old pitch was simple—it was just cheaper. In 2019, hotel daily rates were 42.9% higher than rentals in large cities. But by 2022, that gap had shrunk to 26.6%.
Hotels didn’t sit there. They slashed prices, and it worked. Airbnb still wins for longer stays and larger groups, but the “obviously cheaper” era is fading.
2. Occupancy: hotels stay fuller
U.S. hotels ran at 62.3% occupancy in 2025. Airbnb? Just 39% in early 2026. Hotels keep beds filled through business travel and predictable demand. Airbnb inventory sits emptier, which means more last-minute availability, but also a supply outgrowing demand in many markets.
3. Market size: hotels dominate, rentals grow faster
Hotels operate on another scale entirely—$2,080.57 billion in 2025 versus $97.85 billion for rentals. That’s roughly 21-to-1.
But rentals are gaining. The short-term market is growing 8.8% into 2026, and rentals climbed from 9.7% of all accommodations in 2018 to about 13% in 2022. Hotels are the giants. Rentals are the challenger.
4. Who books what: it’s generational
Your age may predict your booking habits better than your budget. Gen Z leads the Airbnb charge—21% use it most. Flip to Gen X, and it’s a landslide: 74% book hotels. Millennials lean toward hotels too, with 54% calling them more convenient and over 40% saying hotels feel safest. Still, 30% of Millennials will pick Airbnb purely for convenience.
The Final verdict: it depends on the trip
There’s no universal winner. Airbnb wins for longer stays (those 4.1-night averages aren’t an accident), groups, and space over predictability. Hotels win for reliability, easy check-in, and amenities that show up every time.
The travelers coming out ahead aren’t loyal to one side. They read the signals and pick the right tool for the trip in front of them.
FAQs
Other Statistics Posts You Shouldn’t Miss:
- Airbnb Statistics by Country
- Vital Leadership Statistics: Latest Trends and Insights
- Billionaire Statistics: Insights About The World’s Wealthiest
- Business Loan Statistics: Trends Reshaping Funding for Millions
- AI in Education Statistics That Prove the Future Is Already Here
- Women in Leadership Statistics: Insights into Gender Representation
- Soft Skills Statistics: Key Data on Demand, Training, and Impact
- 95+ Fascinating Gift Industry Statistics to Surprise and Delight
- Business Coaching Statistics & Trends Leaders Should Know
- How Much Are People Saving? Personal Savings Statistics
- 40+ Useful Procrastination Statistics To Help You
- 90 Amazing Millionaire Statistics & Facts You Dare Not Miss
- 50+ Latest Life Coaching Statistics And Huge Trends
- Real Estate Photography Statistics and Trends You Need to Know
- Data-Driven Decision-Making Statistics: Benefits & Challenges
- 54 Incredible Goal-Setting Statistics To Help You
- 80+ Franchise Statistics and Facts You Should Know
- 90+ Interesting Film Industry Statistics (NEW Report)
- Ultimate Creator Economy Statistics: Trends, Tools, and Income
- Wealth Management Statistics You Can’t Afford to Ignore

