Did you know that more than 448 million experiences and nights were reserved on Airbnb in 2023? This was almost double the number of bookings of five years ago.
Housing has always been one of the most desired necessities for humans.
Humans don’t just crave shelter; they also crave experiences. This is what Airbnb offers.
Founded in August 2008, Airbnb is a global platform for booking accommodations in over 65,000 cities across 191 countries.
This shows that despite Airbnb’s decline in recent years, as reported by Newsweek, it’s still used across different continents and almost in all countries of the world.
These are the Airbnb statistics by country.
This article provides impressive data that gives you a clear idea of this groundbreaking vacation rental business.
Key Airbnb Statistics by Country (Editor’s Pick)
- Airbnb recently hit a milestone of having over 1 million Superhosts in more than 200 countries.
- 34% of Airbnb hosts in the United States hold Superhost status.
- As of early 2024, New York City had approximately 39,700 Airbnb listings.
- Over 5 million pets travelled on Airbnb listings, including over 210,000 in Canada alone.
- Over the past year, Airbnb has helped 8.4 million visitors stay in 2,600 towns, villages, and cities.
- Nearly 1 million guest arrivals in London at Airbnb properties were booked in areas without hotels.
- 4.8 stars out of 5 is the average rating hosts earn in the UK on Airbnb.
- Airbnb listed over 90,000 rooms and apartments for rent in London.
- Over 3 million guests stayed in Airbnb accommodations in 10 popular European travel destinations where hotels were unavailable.
- In Edinburgh, Airbnb-only areas had an average daily rate of $155, while regions with both Airbnb and hotels had a higher rate of $211.
- Airbnb saw over a 310% surge in Songkran searches in Thailand and a 400% increase in searches for the March-April summer travel season in the Philippines.
- Indonesia has over 61,000 listings, with Bali being the most popular location.
- 53% of South African hosts reported listing space(s) on Airbnb to cover the rising cost of living.
- The top three Airbnb destinations across Africa are South Africa, Morocco, and Reunion Island.
- Over 50,000 Airbnb dwellings in Victoria comprise 1.6% of the state’s housing stock.
General Airbnb Statistics
1. Airbnb net worth as of May 24, 2024, is $93.05 billion. (source)
2. Airbnb recently hit a milestone of having over 1 million Superhosts in more than 200 countries. (source)
Superhosts are hosts who provide exceptional services and experiences for their guests. A superhost badge is granted to a host who consistently provides excellent service and receives good feedback.
3. Within a year, Superhosts have earned more than $23 billion in revenue from hosting on Airbnb. (source)
4. 40% of Airbnb Superhosts identify as women and 29% as men. (source)
5. The global average occupancy rate for Airbnb is 48%. (source)
6. Families can rent an Airbnb with two bedrooms and two bathrooms for about the cost of one hotel room at a major chain. (source)
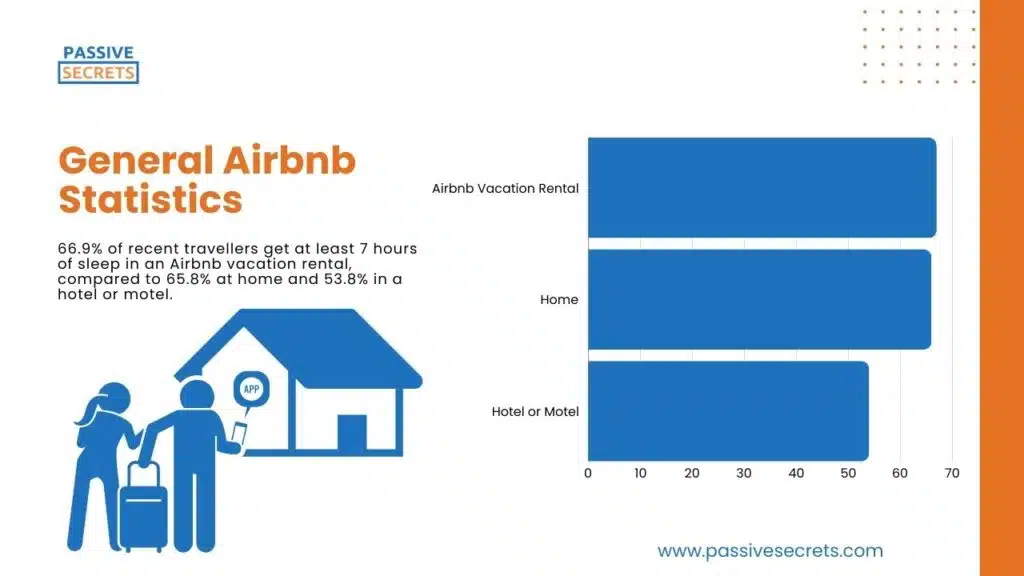
7. 66.9% of recent travellers get at least 7 hours of sleep in an Airbnb vacation rental, compared to 65.8% at home and 53.8% in a hotel or motel. (source)
8. One-quarter of all Airbnb listings have three or more bedrooms. Additionally, cribs for small children can be found in over 1 million listings. (source)
Airbnb Statistics in North America
Airbnb Statistics in the U.S
9. As of February 2024, San Francisco had the highest average price per night for Airbnb rentals among the selected cities in the United States. (source)
In San Francisco, an accommodation listing on the Airbnb website costs an average of U.S. $392 per night. However, it was lower in New York, with U.S. $156 per night.
10. 34% of Airbnb hosts in the United States hold Superhost status. Puerto Rico has the most significant percentage (41%) of Superhosts, making it the most friendly global market. (source)
11. In 2017, 33.9 million adults in the United States used Airbnb, up from 29 million the year before. (source)
12. Most Airbnb listings in New York City, USA, as of January 2024, were for longer-term rentals. (source)
These long-term rentals are rentals for 30 or more days. However, short-term rentals (less than 30 days) accounted for only 11.4% of the available rental properties.
13. As of early 2024, New York City had approximately 39,700 Airbnb listings. (source)
14. Los Angeles had over 45,000 listings, making it the city with the most Airbnb listings in the ranking. (source)
15. The United States has the most Airbnb listings, with an average of 2,249,434 in 2021. (source)
Airbnb Statistics in Canada
16. In 2023, Canada’s Airbnb occupancy rate averaged 27.0%. (source)
17. In 2022, Canadian Airbnb hosts hosted more than 2.2 million guest arrivals in places with no hotels, generating more than CAD 1.5 billion in lost revenues. (source)
18. Airbnb listings were present in nearly 50% of Canada’s distribution areas, but there was no hotel presence. (source)
19. Airbnb listings serve roughly 70% of Toronto and 80% of Vancouver, but no hotels. (source)
20. In 2022, there were approximately 33,751 active Airbnb listings in nine of Canada’s largest cities, but the cities only issued 16,566 short-term rental licenses. (source)
21. Family travel on Airbnb increased by more than 50% in Canada by 2022 compared to pre-pandemic levels. (source)
22. The most popular categories for family travel in Canada on Airbnb are lake houses, skiing, and pools. (source)
23. In 2022, over 5 million pets travelled on Airbnb listings, including over 210,000 in Canada alone. (source)
24. Airbnb hosts in Canada earned over CAD 670 million in 2022 from bookings with families. (source)
Airbnb Statistics in Europe
Airbnb Statistics in the U.K
25. In 2023, the UK’s Airbnb occupancy rate averaged 23.8%. (source)
26. Hosts and guests using Airbnb contributed An estimated £3.5 billion to the UK’s economy between July 2017 and July 2018. (source)
27. 8.4 million visitors have stayed in 2,600 towns, villages, and cities thanks to Airbnb over the past year. (source)
This trend spans the entire UK, with 223,200 active Airbnb listings in England, Scotland, Wales, and Northern Ireland, offering visitors a flexible travel experience.
28. In the past year, 11.1 million UK residents have used Airbnb to travel domestically and internationally. (source)
29. Most UK Airbnb hosts are millennial couples or retirees. (source)
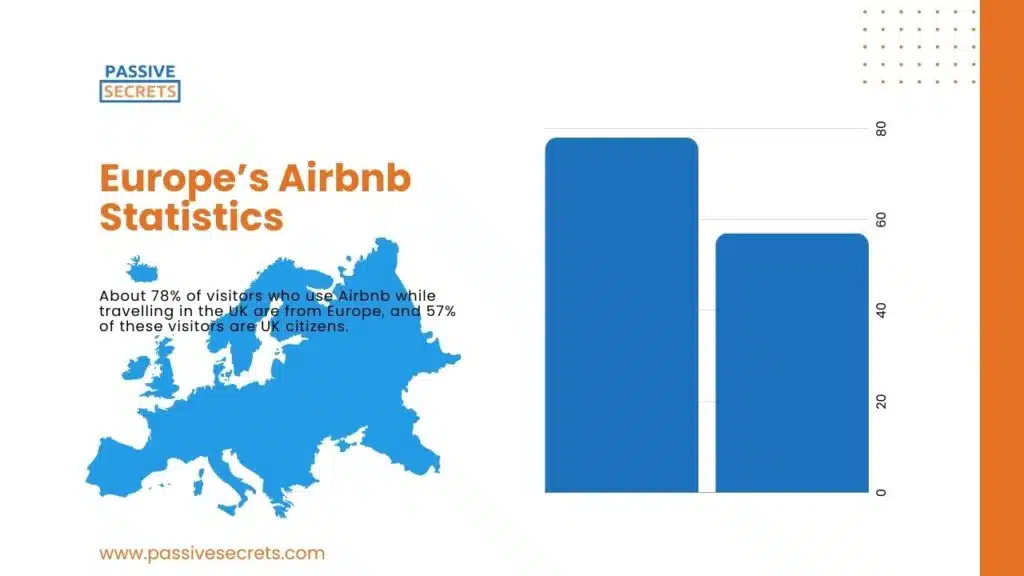
30. About 78% of visitors who use Airbnb while travelling in the UK are from Europe, and 57% of these visitors are UK citizens. (source)
31. 70% of Airbnb guests go to the UK for holidays and leisure. (source)
32. London was one of the first cities to introduce Airbnb Plus for travellers, expanding to 41 cities globally, including Edinburgh, its second UK city. (source)
33. In Edinburgh, people from the UK make up 45% of Airbnb Plus reservations, with Americans accounting for 28% of all reservations. (source)
34. Popular destinations for UK travellers using Airbnb Plus include Cape Town, Los Angeles, Rome, and London, among other cities. (source)
35. An average host on Airbnb Plus in the UK often makes about 75% more than hosts on regular listings. (source)
36. 4.8 stars out of 5 is the average rating that hosts earn in the UK on Airbnb, indicating how much visitors appreciate them. (source)
37. 89% of travellers selected Airbnb because of its amenities. (source)
38. Without being able to utilize Airbnb, 29% of visitors in the UK claim they would not have come or stayed longer. (source)
39. According to 77% of visitors, having the opportunity to use Airbnb increases their likelihood of coming back. (source)
40. In the last year, Airbnb users saved energy equal to 103,000 homes and reduced water usage equivalent to 1,600 Olympic-sized swimming pools. (source)
41. Airbnb has backed various UK projects, including boosting local tourism in Waltham Forest and partnering with Visit Britain to promote domestic travel among millennials in the UK. (source)
42. To encourage domestic travel among UK millennials in England, Scotland, and Wales in 2018, Airbnb partnered with VisitEngland. (source)
43. Airbnb guests during the Royal Wedding contributed over £11 million to Windsor’s economy, restoring its reputation over the wedding weekend and for the future. (source)
44. London experienced the largest year-on-year gain in Airbnb guest arrivals and attendance during Pride out of 100 cities globally. (source)
45. London has over 56,300 active Airbnb rentals, making it the UK city with the highest demand. (source)
The city has a 77% occupancy rate and an average daily rate of £184.4. Rental activity in London is 74% booked, with an average monthly revenue of £2448.78.
However, the cancellation policies in London are usually strict.
46. Cornwall has the highest Airbnb occupancy rate in the UK, peaking at 97% in August. (source)
The cancellation policies in Cornwall are usually very strict, and the average daily rate is £133.5.
47. In 2022, there were nearly 7 million guest arrivals in UK communities with Airbnb properties but no hotels. (source)
48. There were nearly 1 million guest arrivals in London at Airbnb properties booked in areas without hotels, earning local hosts nearly $310 million. (source)
49. Flexible bookers are 23% less likely to stay in Airbnb’s top 20 destinations. (source)
Also, flexible bookers are 18% less likely to stay in Airbnb’s top 50 destinations.
Airbnb Statistics in the Other Countries in Europe
50. France has the second-highest average Airbnb listings, with 1,209,036 in 2021. (source)
51. As of December 2023, Airbnb listed over 90,000 rooms and apartments for rent in London, surpassing all other major European cities. (source)
There were about 74,000 Airbnb listings in Paris, while Rome and Madrid had over 29,000 and 25,000 listings, respectively.
52. In Versailles, 336 Airbnb listings generate €44,377 in annual revenue, with an average daily rate of €138 and an 86% occupancy rate. (source)
53. Compared to regular Airbnb bookers, flexible bookers in Amsterdam stay outside the city’s boundaries more frequently (by 40%). (source)
54. In 2020, non-urban areas accounted for seven out of ten Airbnb stays across the 27 member states of the European Union. (source)
55. A new analysis of Airbnb and Eurostat data reveals that guests make up a modest share of visitors to Europe’s biggest cities, compared to guests using hotels and other accommodations.. (source)
56. Airbnb’s investment in flexible search options is shifting bookings away from Europe’s most popular tourist destinations in favour of more sustainable travel trends. (source)
57. In 2022, over 3 million guests stayed in Airbnb accommodations in 10 popular European travel destinations where hotels were unavailable. (source)
This resulted in over $710 million in earnings for local families hosting on Airbnb.
58. In Amsterdam, over 135,000 guests chose Airbnb stays in regions without hotels, contributing to local Hosts earning a substantial $33 million. (source)
59. More than 450,000 guests in Barcelona opted for Airbnb accommodations in regions lacking hotels, resulting in Hosts earning over $100 million. (source)
60. In Nantes, 1,568 Airbnb listings generated €28,001 annually, with an average daily rate of €91 and an 84% occupancy rate. (source)
61. In Edinburgh, Airbnb-only areas had an average daily rate of $155, while regions with both Airbnb and hotels had a higher rate of $211. (source)
62. According to Deloitte’s analysis, hotels in Ile-de-France, France’s most populated region, hotels were present in 50% of zip codes, while Airbnb hosts offered accommodation in 99% of zip codes. (source)
63. Compared to typical bookers, flexible Airbnb hosts in Barcelona are less likely to reserve rooms in the two most sought-after neighbourhoods, Eixample and Ciutat Vella. (source)
64. Compared to usual bookers, flexible Airbnb hosts in Lisbon are likelier to stay outside the city centre. (source)
65. Flexible Airbnb users in Prague are 17% less likely than regular users to book in the crowded District 1 neighbourhood of the city centre. (source)
66. With an average occupancy rate of 93%, in Paris, an Airbnb host can make up to €42,295 every year. (source)
67. In 2016, Paris was the French city with the most visitors (1.7 million) staying at Airbnb facilities. (source)
68. Nice was the second-most popular Airbnb location in 2016, with over 270,000 tourists, followed by Lyon and Marseille. (source)
Airbnb Statistics in Asia
69. In 2023, India had an average Airbnb occupancy rate of 9.0%. (source)
70. Julian Persaud, Airbnb’s Asia-Pacific regional director, announced a remarkable 700% growth in outbound bookings. (source)
71. Bali stands out for its unique villas, some located in secluded spots. Airbnb provides travellers with the chance to explore these exotic locations. (source)
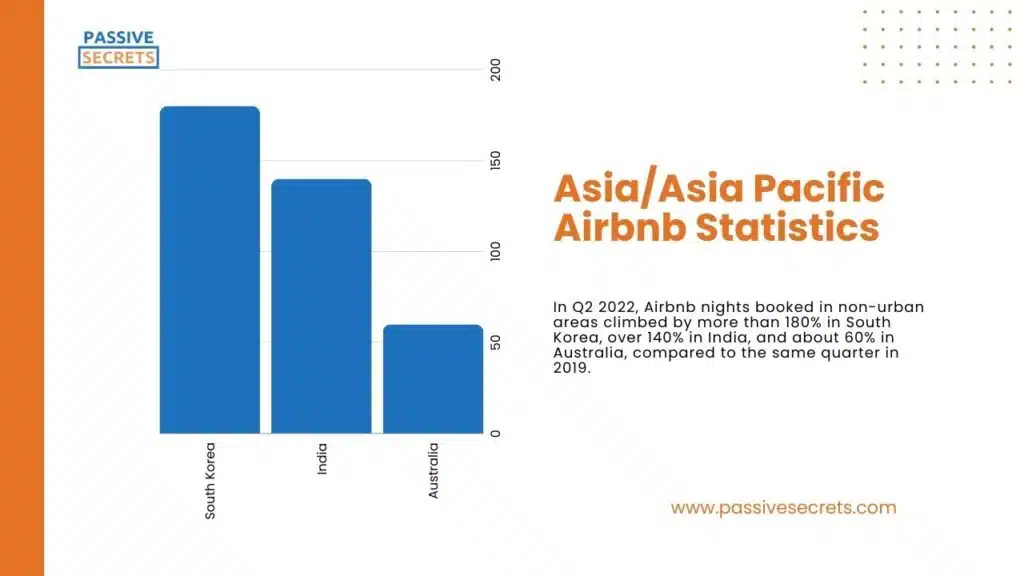
72. In Q2 2022, Airbnb nights booked in non-urban areas climbed by more than 180% in South Korea, over 140% in India, and about 60% in Australia, compared to the same quarter in 2019. (source)
73. A key challenge for Airbnb is the backlash against its marketing strategies in Asia and globally. (source)
74. New Airbnb analysis in Southeast Asia shows that the tourism resurgence is helping locals earn income and meet their financial needs. (source)
75. Before using AirBNB’s services in Asia, customers are now required to present a valid ID from the government. (source)
76. As the K-wave gained global acceptance, Airbnb partnered with the Korea Tourism Organization to showcase unique Korean cultural experiences worldwide through Airbnb Online Experiences. (source)
77. Airbnb saw over a 310% surge in Songkran searches in Thailand and a 400% increase in searches for the March-April summer travel season in the Philippines. (source)
78. China ranks third in 2021, with an average of 1,148,885 Airbnb listings. (source)
79. In Southeast Asia, searches for Airbnb accommodations in Siquijor, Philippines, spiked by over 280%, while searches for Marang in Malaysia nearly doubled. (source)
80. In the Philippines, nearly half of surveyed Airbnb hosts mentioned that their earnings have assisted them in managing increasing living expenses. (source)
81. Across Southeast Asia, several destinations beyond major cities attracted travellers on Airbnb seeking long-term accommodation options. (source)
82. In 2022, Southeast Asia experienced a doubling in the number of nights booked on Airbnb’s platform compared to 2020. (source)
83. In 2022, group travel in Southeast Asia tripled compared to the previous year, and family travel through Airbnb increased by 60% from pre-pandemic levels. (source)
84. According to Airbnb data, long-term stays lasting longer than 28 days increased by more than 2.5 times yearly in 2022. (source)
85. Airbnb recommends that property owners provide family-friendly amenities, unique experiences, and convenient access to hidden destinations for guests. (source)
86. During Ramadan, guest searches increased by about 600% in Malaysia and 500% in Indonesia, respectively. (source)
87. In 2022, Airbnb’s activities provided USD$975 million (IDR 14.4 trillion) to Indonesia’s GDP and supported around 93,000 jobs. (source)
88. As of 2020, Indonesia had over 61,000 listings, with Bali being the most popular location. (source)
89. Airbnb guests in Indonesia spent a total of USD$1.1 billion (IDR 15.7 trillion) in 2022. (source)
90. In 2022, international Airbnb guests accounted for 76% of Indonesian guest expenditure. (source)
Airbnb Statistics In Africa
91. In 2019, Airbnb added nearly R11 billion to South Africa’s GDP, supporting over 28,000 jobs across various sectors. (source)
92. Airbnb added about R23.5 billion to South Africa’s GDP. A 115% increase over the pre-COVID contribution of about R11 billion in 2019. (source)
93. In 2022, nationwide host earnings reached R4 billion ($218 million), a 25% rise from pre-COVID levels of R3.2 billion ($174 million). (source)
94. Despite the crisis in South Africa’s tourism sector in 2020, Airbnb provided over R8 billion to the GDP and supported around 22,000 employees. (source)
95. In 2022, 70% of South African guests reported saving money by using Airbnb. (source)
96. Greater affordability and accessibility of travel via the Airbnb platform allows for tourism to be more inclusive of lower-income guests. (source)
97. 62% of South African Airbnb guests saved on accommodation costs, allowing them to allocate more funds to local goods and services during their stay. (source)
98. Airbnb enables small businesses and homeowners in South Africa to compete with larger, established organizations without incurring significant capital costs. (source)
99. Airbnb helped to create about 50,000 employment across the South African economy in 2022. A 74% increase from the pre-COVID contribution of almost 28,000 employees in 2019. (source)
100. 47% of surveyed guests chose Airbnb over hotels because they wanted to save money, up from 34% in 2021. (source)
101. 53% of South African hosts reported listing space(s) on Airbnb to cover the rising cost of living. (source)
102. Airbnb supports local spending in less common tourist areas in South Africa. (source)
103. South Africa, the pioneering African country on Airbnb, has 43,400 active listings. Hosts typically earn $1,900 annually from sharing their listings for an average of 19 nights per year. (source)
104. In Nigeria, Airbnb is thriving, with 730 active listings. Hosts usually make around $1,000; these listings are typically booked for an average of 13 nights each year. (source)
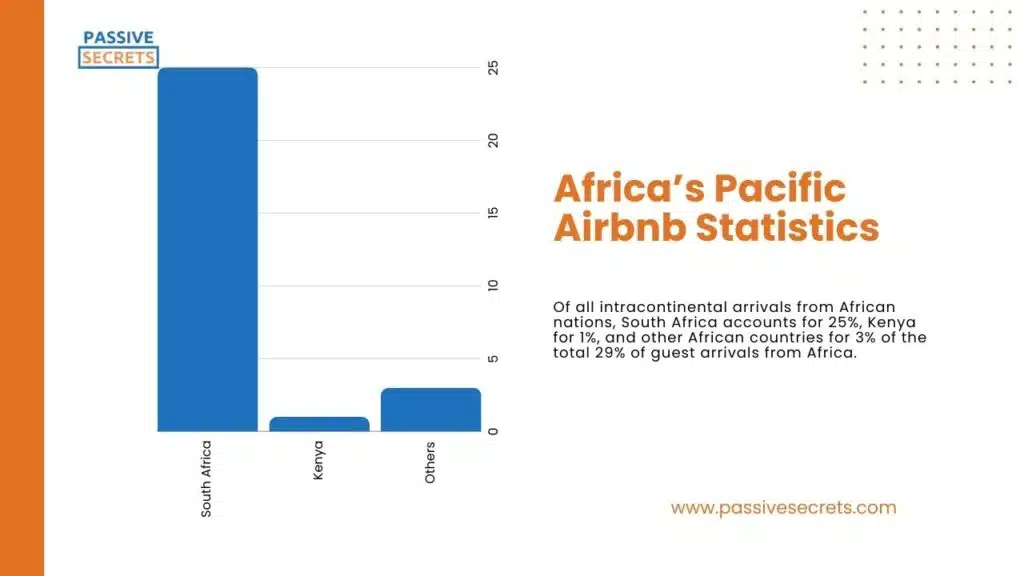
105. Intracontinental travel accounts for most Airbnb Africa visitors: 29% of guests arriving in Africa are from elsewhere on the continent. (source)
106. Of all intracontinental arrivals from African nations, South Africa accounts for 25%, Kenya for 1%, and other African countries for 3% of the total 29% of guest arrivals from Africa. (source)
107. The Airbnb host community in Africa has over 100,000 active listings, with about 18 nights hosted per year for a typical listing. (source)
108. 238% increase in domestic travel on Airbnb in Kenya compared to the previous year. (source)
109. Kenyans’ collective revenues from hosting on Airbnb surged by 106% over the previous year. (source)
110. 40% of Tanzanian host income is earned by women hosts. (source)
111. Active listings in Nigeria have almost doubled since last year, with a 98% increase. (source)
112. Airbnb announced in 2023 that it has over 65,000 listings in South Africa, which is three times its number in October 2017. (source)
113. Last year, people who posted short-term and holiday properties in South Africa on Airbnb made $211 million (4 billion rand). That represented a 25% increase over the pre-pandemic year of 2019. (source)
114. Last year, Airbnb recorded approximately 124,000 bookings in South Africa. (source)
115. The top three Airbnb destinations across Africa are South Africa, Morocco, and Reunion Island. (source)
Kenya, Egypt, and Mauritius are also among the top Airbnb destinations in South Africa.
116. Airbnb is already experiencing an increase in bookings outside of the major cities of Johannesburg and Cape Town. (source)
117. Over 3.5 million visitors have visited listings on Airbnb in Africa so far, with approximately half of these arrivals occurring in only the last year. (source)
118. Africa has more than 130,000 Airbnb listings. (source)
Nigeria, Ghana, and Mozambique are the fastest-growing countries in the world regarding Airbnb guest arrivals.
119. South Africa has one of the highest percentages of female Airbnb home hosts globally, at 65%. (source)
120. In 2022, the average South African Airbnb Host earned approximately R32,500, slightly more than R4 billion. (source)
121. About 50% of South African hosts said the money they earn from hosting helps them cover the rising cost of living. (source)
Also, more than a third said the extra income helps them meet ends.
Airbnb Statistics in Australia
122. In 2023, Australia’s Airbnb occupancy rate averaged 26.4%. (source)
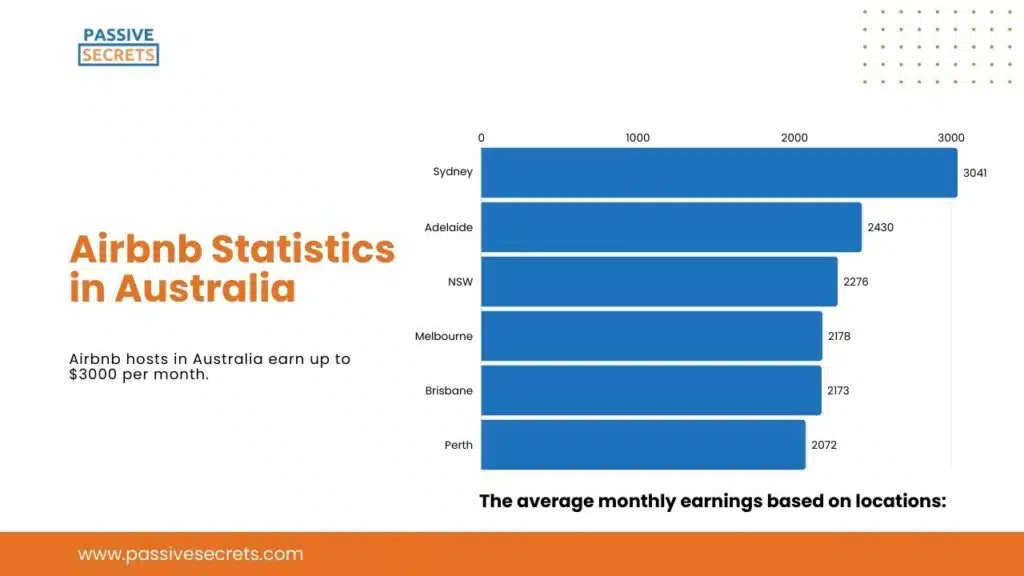
123. Airbnb hosts in Australia earn up to $3000 per month. (source)
The average monthly earnings differ based on locations:
- Sydney – $3041
- Adelaide – $2430
- NSW – $2276
- Melbourne – $2178
- Brisbane – $2173
- Perth – $2072
124. An Airbnb host in Australia can have an occupancy rate of 53% and AUD 5240 in monthly earnings. (source)
125. In April 2022, one-bedroom Airbnbs in Perth and Darwin had the highest occupancy rates among Australian Airbnbs, at 53%. (source)
Melbourne had the lowest Airbnb occupancy rate of 38%.
126. Victoria has over 50,000 Airbnb dwellings, making up 1.6% of the state’s housing stock. (source)
127. The average daily rate for Airbnb in Australia is AUD 278. The average annual revenue is AUD 48,760. (source)
FAQS
1. Where is Airbnb Most Popular in the World?
Airbnb is most popular in London, with over 71,000 properties. However, various cities around the world have a high number of listings, too. Paris has 55,000 listings, and New York has 41,000.
2. What Demographic Uses Airbnb the Most?
Regarding age demographics, 36% of Airbnb visitors are 25 to 34, 15% are youths aged 18 to 24, and only 13% are 55 and older.
3. What City Does Airbnb Make the Most Money?
Miami and San Diego are the most profitable markets for Airbnb hosts. Warm weather and (relatively) affordable housing make these two locations more likely to have full-apartment listings.
4. Which Place has the Most Airbnbs?
London tops the chart with over, easily beating Paris with 55,000 listings.
Related Posts:
- Thought-Provoking Gender Inequality Statistics: 160+ Insights Across Regions
- 110+ Shocking Income Inequality Data You Need to Know
- 50 Interesting Sharing Economy Statistics You Need to Know
- 100+ Animation Statistics: The Ultimate Guide To The Industry’s Trends and Insights
- 80+ Franchise Statistics and Facts You Should Know In 2024
- The Future of Learning: 50+ Top EdTech Statistics For 2024
- The Web3 Statistics Report 2024: Trends, Insights, and Predictions
- Meme Statistics 2024: Facts, Trends, and Figures That Will Blow Your Mind
- 85+ MOST Interesting Anime Statistics and Facts (NEW Report)
- Board Game Statistics: Revenue, Market Size, Demographics & More
- 50+ Interesting Born Into Poverty Stay In Poverty Statistics
- 90+ Interesting Film Industry Statistics (NEW Report)
- 80+ Alarming Technology Addiction Statistics You Must Know
- 65+ Impressive Chess Statistics and Facts To Know in 2024
- Spotify Statistics: Latest Report on The Music Streaming Platform
- 50+ Useful Video Game Addiction Statistics, Facts & Huge Trends
- 50+ Vital Internet Safety Statistics & Facts You Must Know
- Internet Dangers Statistics: A Look At The Internet’s Dark Side
- 50 Interesting Bible Statistics and Facts You Didn’t Know
- 95+ Interesting Dream Statistics and Facts You Can’t-Miss
- 75+ Interesting Relationship Statistics & Facts You Should Know
- Dance Statistics: A Deep Dive Into The Rhythm Of Movement
- 40+ Incredible Single Father Statistics You Have to Know
- The Battle of the Sexes: Male Vs. Female Spending Statistics
- 95+ Jaw-Dropping Period Poverty Statistics You Need To Know
- 70 Exciting Love Statistics And Facts (True Love, Intimacy, Marriage, Dating & Relationships)
- 30+ Gentle Parenting Statistics & Facts: Is This Parenting Style Worth It?
- 55+ Useful Black Consumer Spending Statistics (2024 Report)
- Holiday Spending Statistics: Valentine’s Day, Easter, Thanksgiving, & Christmas

