As we advance into a future where decentralized technologies are redefining the fabric of the internet, the world of Web3 is witnessing an unprecedented surge in adoption and innovation.
Amidst this revolution, Web3 statistics are painting a telling tale of a paradigm shift, where the boundaries of digital interaction are being pushed like never before.
Web3 numbers show a big change: more people are using cryptocurrency and metaverse technology, marking a new era in connecting and sharing value.
In this report, we’ll examine the most compelling Web3 statistics shaping the future of the Internet and beyond.
Key Web3 Statistics
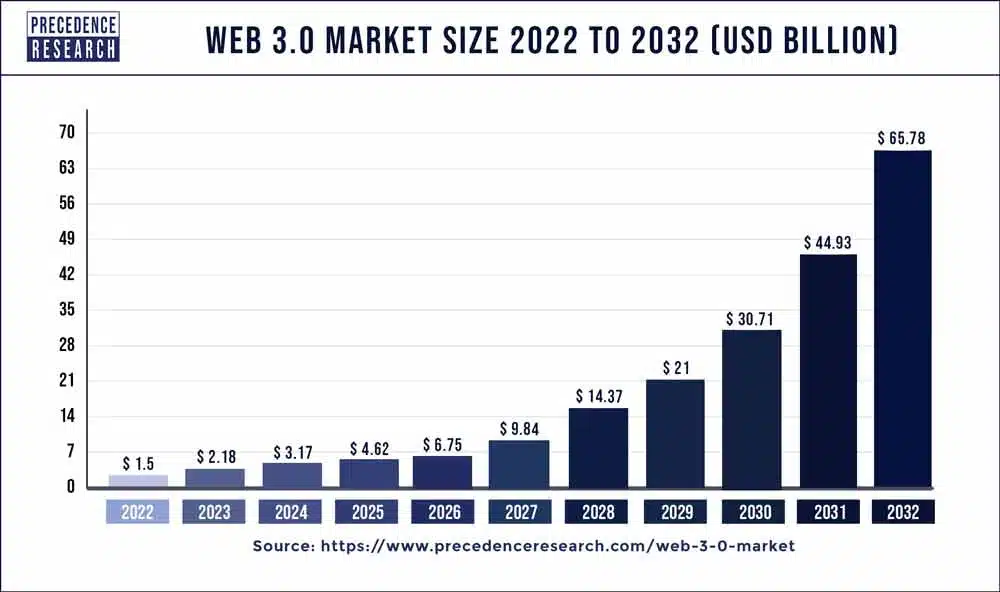
- The global Web 3.0 market was valued at USD 2.18 billion in 2023 and is expected to grow to roughly USD 65.78 billion by 2032.
- Globally, 92% of people know crypto, with the highest awareness in Nigeria, South Africa, and Brazil.
- 61% of all web3 startups are based in California, New York, Florida, or Texas.
- Globally, 92% of people know cryptocurrencies, with 50% claiming to understand them.
- The Web3 ecosystem boasts a cumulative market capitalization exceeding US$27.5 billion.
- 40% of Americans now know about NFTs (up from 27% two weeks earlier), and 81% know them.
- Web 3.0 adoption is expected to rise by 50% over the next three years.
- Around 70% of individuals in emerging markets intend to use at least one Web3 service, in contrast to just 31.7% in developed markets.
- Nearly half of crypto buyers and sellers are millennials.
General Web3 Statistics
1. The global web 3.0 market was valued at USD 2.18 billion in 2023 and is expected to grow to roughly USD 65.78 billion by 2032, with a CAGR of 46% between 2023 and 2032. (source)

2. 29. The web 3.0 market in the United States was valued at USD 0.54 billion in 2023 and is predicted to reach USD 16.34 billion by 2032, increasing at a CAGR of 46.20% between 2023 and 2032. (source)
3. According to Cognitive Market Research, North America accounted for about 40% of global revenue in 2023, driven by the region’s strong adoption of decentralized technologies like blockchain and smart contracts. (source)
4. The increasing demand for the Web 3.0 market stems from the growing necessity for secure and transparent digital transactions. (source)
5. Globally, 92% of people are aware of crypto, with the highest awareness in Nigeria, South Africa, and Brazil. However, only a small fraction (8%) feel very familiar with the concept of web3, indicating a knowledge gap beyond basic cryptocurrency awareness. (source)
6. Asia Pacific presents emerging opportunities in various web 3.0 industry verticals. (source)
7. In November 2023, Amazon Web Services, Animoca Brands, and Polygon Labs collaborated to support Web 3.0 developers and expedite the development of Web 3.0 products and services. (source)
8. The North American market dominated in 2023, representing 37.3% of global revenue. The increased utilization of Web 3.0 across various operating systems, including blockchain-based systems, is a significant driver of regional market growth. (source)
9. For end-use, the BFSI segment held the largest market revenue share in 2023, at 36.12%. This growth is fueled by the growing demand for Web 3.0 blockchain for scalability, faster transaction speeds, and reduced processing costs in the banking and finance sector. (source)
10. In 2021, Kenya, Nigeria, and South Africa collectively received 70% of Africa’s blockchain funding, totalling $88.5 million. (source)
11. Regarding Blockchain Type, the Public segment led the market in 2023, capturing 56.4% of global revenue. (source)
12. A 2023 survey of South Korean game developers and publishers found that most respondents weren’t integrating Web 3.0 tech into their games, with VR/AR being the most common exception. Mobile game companies (76%) were less likely to adopt Web 3.0 features than PC game companies (5%). (source)
13. Europe is experiencing the fastest growth in the Web 3.0 blockchain market due to their governments embracing blockchain for secure data management and financial services. (source)
14. 61% of all web3 startups are based in California, New York, Florida, or Texas. (source)
15. Additionally, California, New York, and Florida have received the most Web3 venture capital investments, totalling $18 billion, $9.7 billion, and $2.2 billion, respectively. (source)
16. Over 5,700 Web3 startups have been founded since 2007, resulting in over $42 billion in venture capital investment. The sector has received about $107 billion in investment, including venture capital, mergers and acquisitions, private equity, and IPOs. (source)
17. Web3 companies create hundreds of thousands of jobs nationwide, many tiny businesses with fewer than 50 employees. (source)
18. The “creator economy,” valued at $250 billion, encompasses individuals with their own brands and audiences. As Web3 technologies emerge, this sector is expected to grow. (source)
However, only 38% of global respondents feel fairly compensated for their online contributions. Notably, 67% of Nigerians believe they add value to the internet, contrasting with just 5% of Japanese respondents.
19. Globally, 92% of people are aware of cryptocurrencies, with 50% claiming to understand them. Awareness is highest in Nigeria (78%), South Korea (63%), South Africa (61%), Brazil (59%), and India (56%), while Indonesia and Japan have lower levels of understanding (33% each). (source)
20. In Argentina, 56% of respondents were driven to invest in cryptocurrency to store value due to the instability of their local currency. This percentage is the highest worldwide, likely attributed to the country’s high inflation rate of 89.1% as of April 2023. (source)
21. The global crypto regulatory landscape is diverse, with 40% of countries having established frameworks, 34% developing them, 17% yet to start, and 9% prohibiting cryptocurrencies, reflecting varying approaches to regulation. (source)
22. The Web3 ecosystem, boasting a cumulative market capitalization exceeding US$27.5 billion, has emerged as a prominent force in the technology industry, dedicated to reshaping global systems. (source)
23. The FinTech blockchain market witnessed substantial growth, with the number of FinTech unicorns surging by over 60% in a year. Estimates suggest the market reached approximately $6,228.2 million in 2023, representing a remarkable 75.9% compound annual growth rate from 2017. (source)
24. In 2022, 46% of finance apps developed by a software product engineering firm were built on Web 3.0 technology, indicating a significant shift toward decentralized frameworks. (source)
25. After the 2018 and 2021 cryptocurrency market peaks, newcomer developers flooded the market, accounting for 70% and 60% of all developers, respectively, in the six months following each peak. (source)
26. An estimated 7,700 newcomer developers exited cryptocurrency in June 2022. Conversely, there was an increase of 1,650 emerging developers with up to two years of experience and 150 established developers with over two years of experience during the same period. (source)
27. The influx of new developers into the cryptocurrency sector experienced a notable decline of nearly 50% over the past year. (source)
28. Analysis from May 2022 reveals that finance apps accounted for approximately 46% of all mobile apps leveraging the “Web3” keyword, followed by 9% in social apps, tools, and utility apps. Less than six in 10 mobile gaming apps utilized the keyword during the same period. (source)
29. Self-hosted wallets are gaining widespread acceptance, with 39% of users opting for software wallets and 29% using hardware wallets. (source)
30. 40% of Americans now know about NFTs (up from 27% two weeks earlier), and 81% know them. (source)
Web3 Adoption Statistics
31. Web 3.0 adoption is expected to rise by 50% over the next three years. (source)
Centralized exchange trading and crypto gaming are the most used Web 3.0 applications. However, in the future, people anticipate using cryptocurrency more as a payment method, especially in developing countries with limited access to financial services.
32. Many individuals need more understanding to utilize Web 3 services. About 46% of non-users cite unfamiliarity with the technology as a barrier to adoption, while 26% are unsure where to begin. (source)
33. The rising adoption of Web 3.0 cryptocurrencies for automating Internet transactions is expected to boost industry growth. (source)
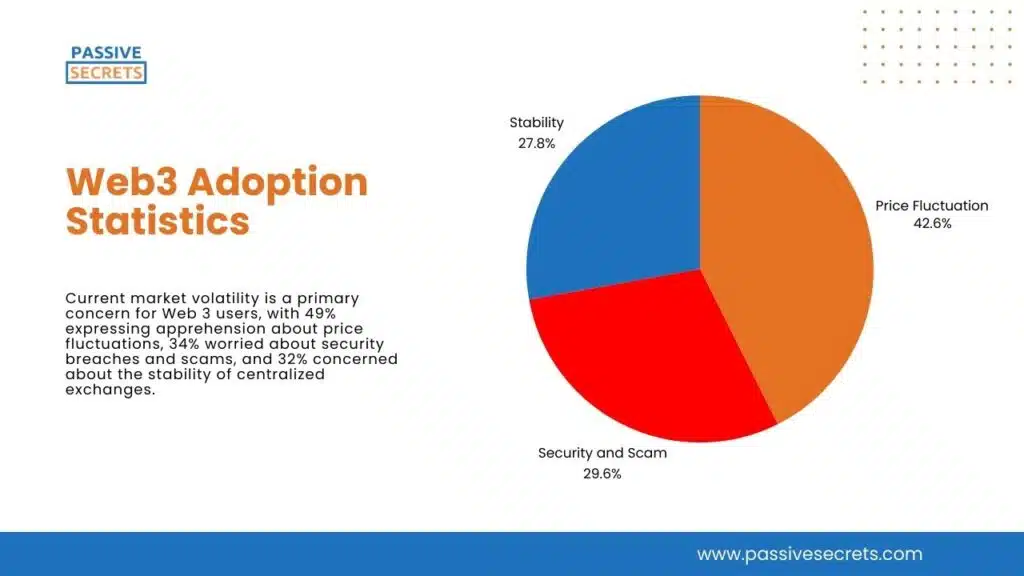
34. Current market volatility is a primary concern for Web 3 users, with 49% expressing apprehension about price fluctuations, 34% worried about security breaches and scams, and 32% concerned about the stability of centralized exchanges. (source)

35. Government attitudes toward Web 3 are crucial in driving adoption. Approximately 26% of crypto users express concern about government regulations, while 18% are wary of government efforts to discourage crypto usage. This sentiment is particularly pronounced in countries like India and Canada. (source)
36. Web 3 and crypto enjoy widespread recognition worldwide. About 82% of individuals claim awareness of crypto, while 66% are familiar with at least some aspects of Web 3. Awareness tends to be higher in Europe and lower in Japan and other emerging economies (source)
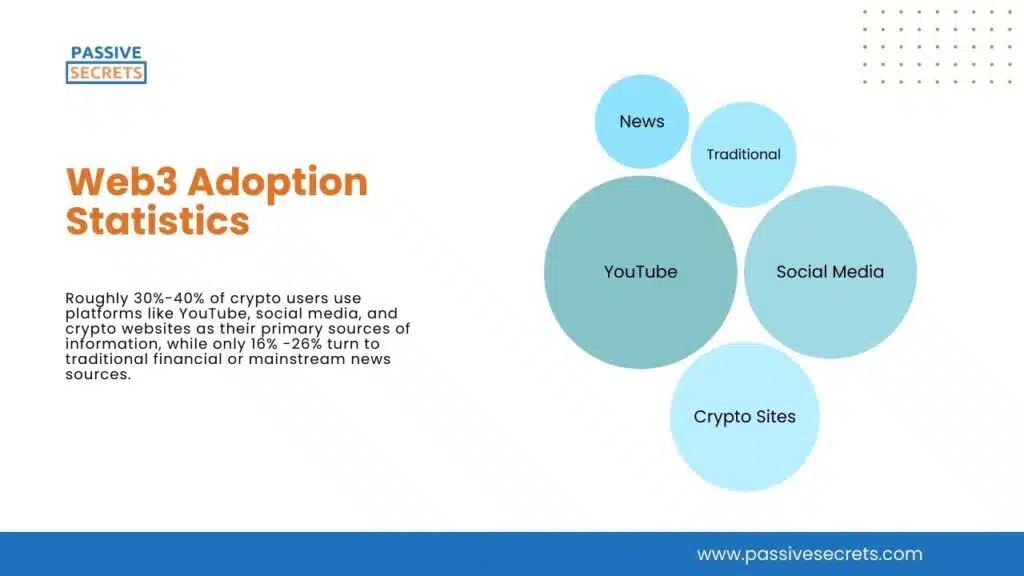
37. Crypto users predominantly rely on social media and alternative financial news outlets to stay informed about Web 3. Roughly 30%-40% of crypto users use platforms like YouTube, social media, and crypto websites as their primary sources of information, while only 16% -26% turn to traditional financial or mainstream news sources. (source)

38. India’s global share of blockchain developers surged from 3% in 2018 to 12% in 2023, signifying substantial growth. (source)
39. India leads in on-chain adoption among 150 countries in 2023, boasting over 35 million trading accounts on top Indian exchanges. (source)
40. Over 29% of respondents spend more than Rs. 1,000 on Web3 games, compared to 10% among Web2 games, indicating a growing interest in Web3 experiences. (source)
41. The adoption of Web3 and blockchain presents significant global opportunities for Indian tech talent and businesses. (source)
42. Between 2020 and 2023, the U.S. consistently ranked in the top 10 globally for crypto adoption based on transaction volume. The United States ranked second worldwide for on-chain retail value received from DeFi protocols – or consumers who purchased specific DeFi protocols. (source)
43. In Turkey, the Binance app is widely used for crypto transactions, with local platforms like BtcTurk PRO, Paribu, and Binance TR capturing approximately 36% of the market share. (source)
44. According to the CoinGecko report on crypto interest in Africa, Nigeria leads with 66.8% of crypto interest year to date (YTD), surpassing the second-ranked country by over sevenfold. In a global report on countries with the most curiosity about crypto, Nigeria claimed the top spot, while Kenya ranked 15th. (source)
45. Major adoption milestones in the past year include South African grocery retailer Pick n Pay accepting Bitcoin in approximately 1,628 stores. This adoption level represents the largest by a single physical store on the continent and is among the most extensive globally. (source).
46. A blockchain analytics platform suggests that Ghana exhibits potential for crypto adoption, similar to Nigeria and Kenya. (source)
47. Triple-A, a cryptocurrency provider and aggregator based in Singapore, estimates that 0.9 million Moroccans own cryptocurrency, accounting for about 2.4% of the total population. Morocco ranks as the top country in North Africa and is among the top 50 globally regarding crypto ownership per population. (source)
48. Around 70% of individuals in emerging markets intend to use at least one Web3 service, in contrast to just 31.7% in developed markets. Nearly 80% of respondents in the Philippines aim to embrace a Web3 service, while only 35% of people in Australia have similar plans. (source)
49. 46% of the respondents surveyed intend to adopt at least one of the ten Web3 services in the future, more than the current 31% who use Web3. (source)
Notably, the number of people planning to use three or more services is three times higher, and twice as many are interested in using at least two services. This indicates a general optimism among respondents about their future use of Web3 services.
50. In the UK, a significant majority (76%) of people familiar with NFTs have never owned one, whereas in Vietnam, only a minority (24%) of those familiar with NFTs have never owned one. (source)
This indicates a significant difference in NFT adoption between the two countries. The statistic suggests that Vietnamese respondents are more likely to engage with NFTs than their UK counterparts.
Web3 Demographic Statistics
51. As of August 2021, approximately 13% of the U.S. population had engaged in cryptocurrency investment, with a majority (61%) beginning their investment journey in 2021, indicating significant growth in this accessible opportunity within Web3. (source and source)
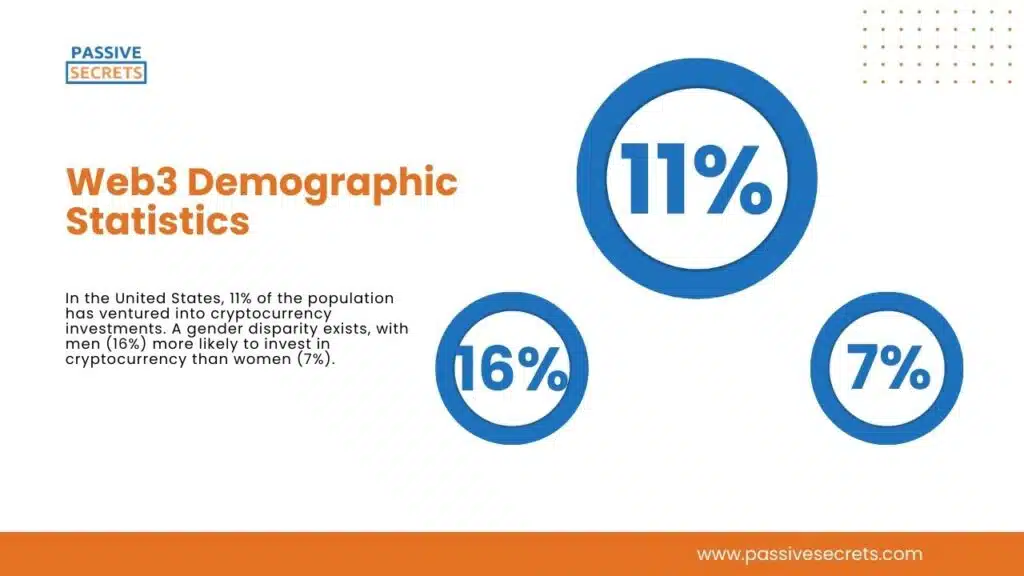
52. In the United States, 11% of the population has ventured into cryptocurrency investments. A gender disparity exists, with men (16%) more likely to invest in cryptocurrency than women (7%). (source)

This trend persists across various racial and ethnic groups. Age also plays a role, as younger and middle-aged individuals (15% and 11%, respectively) are more likely to invest in cryptocurrency than their older counterparts (4%). Interestingly, only a small fraction of investors (3%) were motivated to start investing due to the impressive growth of cryptocurrency.
53. Nearly half of crypto buyers and sellers are millennials, typically demonstrating proficiency with technology and favouring established or rigorously scrutinized cryptocurrencies. (source)
54. Men aged 25-34 have the highest understanding of cryptocurrencies, while women and older adults tend to have less knowledge. This means that there is a gender and age gap in cryptocurrency literacy. (source)
55. Business demand for metaverse transformation is growing rapidly, with 67% of respondents already engaged. While women make up a significant proportion of gamers in the US (45%) and China (40-45%), they show less interest in metaverse experiences than men. (source)
56. Urban consumers are growing interested in the metaverse, with 68% eager to engage. This group is primarily composed of Gen Z (18-25) and Millennials (25-40), with a slightly higher concentration of affluent individuals (household income >$65,000). (source)
Latest Web3 Trends
Web3 is the next big thing in technology, changing how we interact with the Internet. As we move into 2024 and beyond, several key trends showcase Web3’s potential to transform various aspects of our lives. Let us explore some exciting trends.
1. Account Abstraction
In simple terms, account abstraction is having a single account that can manage all your online activities, from social media to banking.
It’s a way to simplify user experience and improve security by allowing for more flexible account management.
This means you can set daily transaction limits, use multi-signature authorization, and integrate your existing accounts seamlessly. As developers work to make Web3 more accessible, account abstraction is expected to play a key role in this effort.
2. Utility NFTs
NFTs (Non-Fungible Tokens) are a way to buy and sell digital art and collectables. Utility NFTs, on the other hand, take these digital transactions to the next level.
They provide real-world benefits and functionalities to their holders, such as access passes, ownership rights, or even fractional ownership of physical assets.
As the technology matures, utility NFTs will become increasingly integrated into various industries, from real estate to supply chain management.
3. Decentralized Metaverse
The metaverse is a shared virtual space where users can interact, socialize, and engage in various activities.
In 2024, we expect to see the emergence of decentralized metaverse platforms built on Web3 technologies.
These platforms will help to prioritize user ownership, privacy, and control over their digital assets and experiences.
By leveraging decentralized technologies like blockchain and NFTs, the decentralized metaverse will offer a more equitable and transparent alternative to centralized metaverse platforms.
These trends highlight Web3’s transformative potential in the coming years. From simplifying user experience to enabling new asset ownership and exchange models, Web3 is expected to reshape the digital landscape.
As the technology matures and gains mainstream adoption, we expect to see even more exciting developments and innovations emerge in the Web3 space.
Conclusion
As the Web3 landscape continues to evolve at breakneck speed, one thing is certain: the future of the Internet will be decentralized, democratic, and driven by community.
The Web3 statistics outlined in this report serve as a testament to the unrelenting pace of innovation in this space, from the explosive growth of blockchain funding in Africa to the burgeoning interest in metaverse experiences among urban consumers.
As we navigate this uncharted territory, one thing is clear: Web3 is not just a technological shift but a fundamental transformation of how we interact, create value, and connect with each other.
Stay tuned, for the Web3 revolution has only just begun, and the statistics will continue to tell the story of a new internet, built by the people, for the people.
FAQs
-
How fast is Web3 growing?
The global Web 3.0 market size was valued at USD 2.25 billion in 2023 and is expected to grow at a compound annual growth rate (CAGR) of 49.3% from 2024 to 2030.
-
How big is the Web3 technology market?
The global Web 3.0 market size was estimated at USD 2.18 billion in 2023 and is projected to hit around USD 65.78 billion by 2032.
-
How many Web3 developers are there in the world?
According to the crypto VC firm Electric Capita, as of January 2023, there were over 18,000 monthly active developers in the Web3 ecosystem.
-
How long does it take to learn Web3 coding?
It can take around two years for beginners to become professional Web3 developers from scratch.

Related Posts:
- Thought-Provoking Gender Inequality Statistics: 160+ Insights Across Regions
- 110+ Shocking Income Inequality Data You Need to Know
- 50 Interesting Sharing Economy Statistics You Need to Know
- 100+ Animation Statistics: The Ultimate Guide To The Industry’s Trends and Insights
- 80+ Franchise Statistics and Facts You Should Know In 2024
- The Future of Learning: 50+ Top EdTech Statistics For 2024
- Meme Statistics 2024: Facts, Trends, and Figures That Will Blow Your Mind
- 85+ MOST Interesting Anime Statistics and Facts (NEW Report)
- Board Game Statistics: Revenue, Market Size, Demographics & More
- 125+ Interesting Airbnb Statistics by Country (Deep Insights)
- 50+ Interesting Born Into Poverty Stay In Poverty Statistics
- 90+ Interesting Film Industry Statistics (NEW Report)
- 80+ Alarming Technology Addiction Statistics You Must Know
- 65+ Impressive Chess Statistics and Facts To Know in 2024
- Spotify Statistics: Latest Report on The Music Streaming Platform
- 50+ Useful Video Game Addiction Statistics, Facts & Huge Trends
- 50+ Vital Internet Safety Statistics & Facts You Must Know
- Internet Dangers Statistics: A Look At The Internet’s Dark Side
- 50 Interesting Bible Statistics and Facts You Didn’t Know
- 95+ Interesting Dream Statistics and Facts You Can’t Miss
- 75+ Interesting Relationship Statistics & Facts You Should Know
- Dance Statistics: A Deep Dive Into The Rhythm Of Movement
- 40+ Incredible Single Father Statistics You Have to Know
- The Battle of the Sexes: Male Vs. Female Spending Statistics
- 95+ Jaw-Dropping Period Poverty Statistics You Need To Know
- 70 Exciting Love Statistics And Facts (True Love, Intimacy, Marriage, Dating & Relationships)
- 30+ Gentle Parenting Statistics & Facts: Is This Parenting Style Worth It?
- 55+ Useful Black Consumer Spending Statistics (2024 Report)
- Holiday Spending Statistics: Valentine’s Day, Easter, Thanksgiving, & Christmas

