In this day and age, having a million dollars in the bank is something that everyone seeks to achieve. This is because having a million dollars in the bank allows you to fend for yourself and your family and places you in the ranks of the elite.
From tech millionaires to millionaires by inheritance, the world of the super-rich is fascinating, and their numbers are growing.
But what does it really mean to be a millionaire in 2024?
This article will explore the 2024 millionaire statistics, offering insights into the lifestyles, spending habits, and demographics of millionaires.
Top Millionaire Statistics (Editor’s Pick)
- There are currently only 59.4 million millionaires in the world.
- Alphabet, Amazon, and Meta are the top 3 companies that are making millionaires through online earning opportunities.
- Switzerland is the country with the most millionaires.
- 75% of millionaires attribute their financial success to consistent and sustained investing over an extended period.
- In the United States, there are 79% of self-made millionaires.
- 93% of millionaires attribute their wealth to hard work rather than high salaries.
- There are about 1.79 million African American millionaires in the U.S.
- 73% of millionaires have never carried a credit card balance in their lives.
- There are 43,457 female ultra-high-net-worth individuals.
- There are almost 24.5 million millionaires in the United States today.
- There are about 135,200 millionaires in Africa.
General Millionaire Statistics in 2024
1. There are currently only 59.4 million millionaires in the world. (source)
These people have a net worth of at least one million US dollars. This figure is actually a 3.5 million decline as the wealth share of the global top 1% fell to 44.5%.
2. Global wealth will rise by 38% over the next five years, reaching USD 629 trillion by 2027. (source)
3. Alphabet, Amazon, and Meta are the top 3 companies making millionaires through online earning opportunities (source)
4. According to a report, Switzerland has the most millionaires. (source)
Here is a table showing the countries with the most millionaires.
| Country | Population | Percentage of Millionaires | Total Millionaires | |
| 1. | Switzerland | 8.7 Million | 13.78% | 1.2 Million |
| 2. | Australia | 25.68 Million | 8.56% | 2.2 Million |
| 3. | Hong Kong | 7.41 Million | 8.52% | 632,000 |
| 4. | United States | 332.01 Million | 7.38% | 24.5 Million |
| 5. | New Zealand | 5.11 Million | 6.78% | 5.11 Million |
| 6. | Denmark | 5.86 Million | 6.57% | 385,000 |
| 7. | Netherlands | 17.53 Million | 6.27% | 1.1 Million |
| 8. | Canada | 38.23 Million | 6.02% | 2.3 Million |
| 9. | Sweden | 10.41 Million | 5.86% | 610,000 |
| 10. | Singapore | 5.45 Million | 5.48% | 299,000 |
| 11. | Norway | 5.41 Million | 4.37% | 236,000 |
| 12. | United Kingdom | 67.02 Million | 4.18% | 2.8 Million |
| 13. | France | 67.76 Million | 4.13% | 2.88 Million |
| 14. | Taiwan | 23.89 Million | 3.64% | 869,000 |
| 15. | Ireland | 5.03 Million | 3.49% | 176,000 |
5. The total number of USD millionaires worldwide is expected to reach is expected to reach 86 million by 2027. And the number of ultra-high-net-worth individuals (UHNWIs) is expected to be 372,000 individuals. (source)
6. By the end of 2022, the total global wealth reached $454.4 trillion. This is a 2.4% decrease from the previous year which was at $463.6 trillion. (source and source)
7. There are 4x as many US dollar millionaires in the world today as there were at the turn of the century. (source)
8. 8 out of 10 millionaires contributed to their company’s 401(K) plan, a straightforward action that played a significant role in their financial achievement. (source)
9. Three-quarters(75%) of millionaires attribute their financial success to consistent and sustained investing over an extended period. (source)
10. There are about 4,395,400 “inflation millionaires” worldwide. (source)
North America and Europe each have 1.4 million inflation millionaires, while Asia Pacific (excluding China and India) has 800,000 combined.
On the other hand, China has over 500,000 inflation millionaires, and Africa accounts for the remaining 180,000.
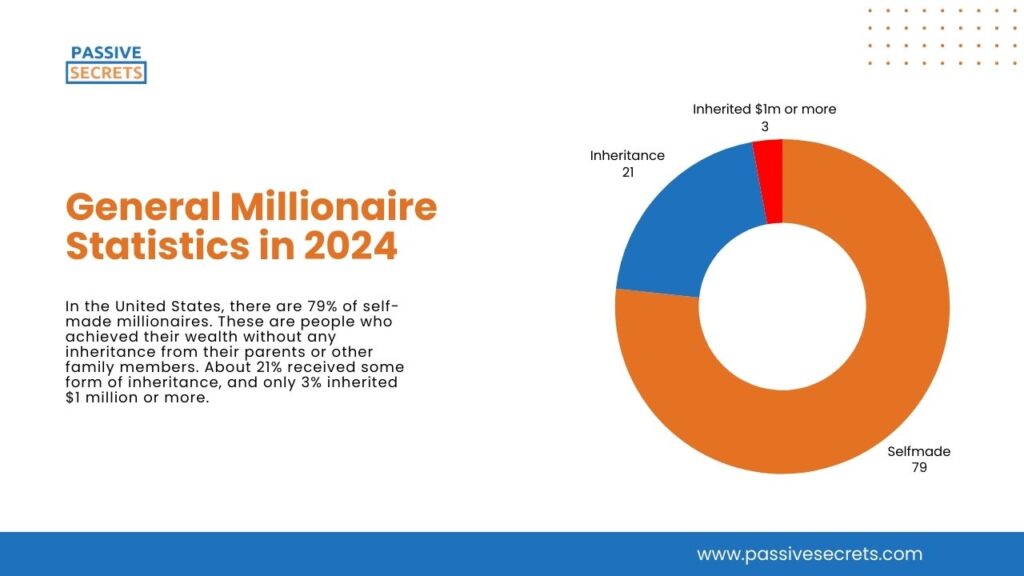
11. In the United States, there are 79% of self-made millionaires. These are people who achieved their wealth without any inheritance from their parents or other family members. About 21% received some form of inheritance, and only 3% inherited $1 million or more. (source)

12. 8 out of 10 millionaires originate from families that are middle-income or lower, while only 2% report coming from wealthy, upper-income backgrounds. (source)
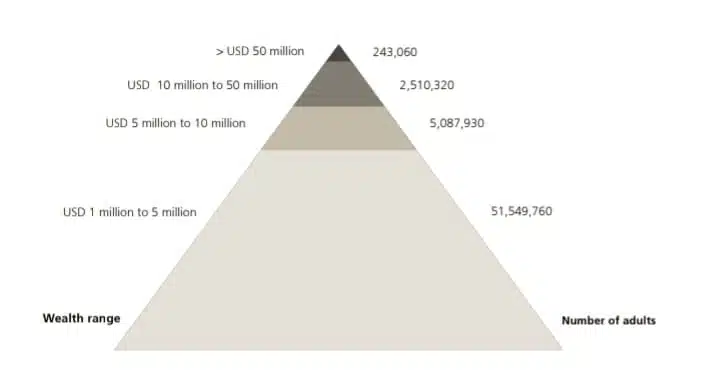
13. Of 59.4 million millionaires, a vast majority (51.5 million) of them have wealth of USD 1 million to 5 million. (source)
Another 5 million have a wealth of USD 5 million to 10 million, and 2.5 million millionaires have a wealth of USD 10 million to 50 million.
However, only 240,000+ millionaires have surpassed the USD 50 million mark.

14. 93% of millionaires attribute their wealth to hard work rather than high salaries. Only 31% earned an average of $100,000 annually throughout their careers, and one-third never reached a six-figure income in any given year. (source)
15. Approximately 62% of millionaires completed their education at public universities, whereas only 8% attended elite private institutions. (source)
16. 88% of millionaires have a college degree, whereas only 38% of the wider population does. (source)
17. There are about 1.79 million African American millionaires in the U.S. (source)
18. Approximately 52% of the millionaires surveyed held a master’s or doctoral degree, in contrast to just 13% of the broader population. (source)
19. A study identified the top five professions among millionaires as engineers, accountants (CPAs), teachers, managers, and attorneys. (source)
20. As of April 2023, Mark Mateschitz, the heir to Red Bull, held the title of the world’s youngest billionaire. (source)
He was followed by Leonardo Maria, Clemente, and Luca del Vecchio, who inherited their fortunes from the Italian luxury brand Luxottica. This data reveals that the top 15 youngest billionaires all came into their wealth through inheritance.
21. In 2022, the highest number of billionaires was found in North America, surpassing 1000. Europe and Asia closely followed behind. (source)
22. By December 2023, Elon Musk was the wealthiest person globally, with a net worth of $257.6 billion. Bernard Arnault, who owns the luxury goods company LVMH, and his family were the second wealthiest. Amazon founder Jeff Bezos was in third place. (source)
23. Americans dominate the list of billionaires, with Francoise Bettencourt Meyers being the sole woman in the top 20 wealthiest individuals globally. (source)
24. By the close of 2022, the mean wealth per adult stood at approximately $84,718. (source)
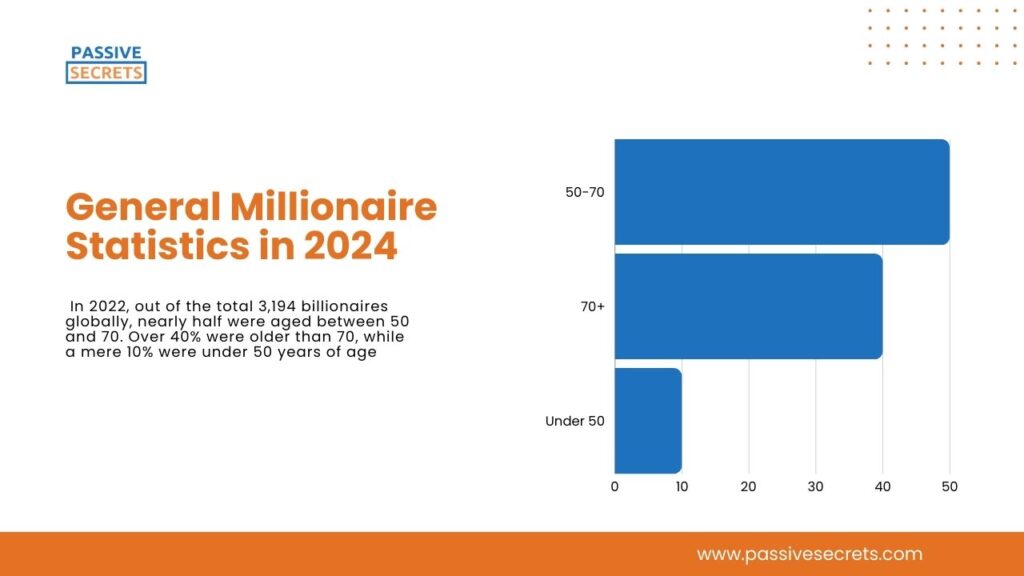
25. In 2022, out of the total 3,194 billionaires globally, nearly half were aged between 50 and 70. Over 40% were older than 70, while a mere 10% were under 50 years of age. (source)

26. In 2021, the Asian country accounted for an increasingly large share of the world’s billionaires, with close to 700 of its citizens estimated to be in that category. (source)
27. Typically, the majority of wealth for billionaires under 50 is derived from public holdings. For those over 50, approximately 40% of their wealth is also from public holdings, with over 30% coming from private assets. (source)
28. In 2022, Switzerland topped the list of countries by average wealth per adult, with an estimated $685,000 for each person. The United States followed, ranking second with an average adult wealth of about $550,000. (source)
29. During the COVID pandemic, the disparity in global wealth increased, adding 5.2 million people to the world’s millionaires as the affluent benefited from rising stock and real estate values. (source)
30. For the first time in 2020, dollar millionaires made up over 1% of the world’s population. Data indicates that there were 56.1 million people with assets exceeding $1 million that year. (source)
31. It is projected that global wealth will increase by 39% in the next five years, reaching $583 trillion by 2024. Additionally, the population of millionaires is anticipated to grow by 50%, totaling 84 million people. (source)
32. The population of ultra-high-net-worth individuals is projected to increase by approximately 60%, totaling around 344,000 people by the year 2025. (source)
33. The 2024 Forbes list of global billionaires reports that there are 2,781 billionaires worldwide. (source)
Personality Traits of Millionaires
34. Millionaires who inherited their wealth placed a higher value on the role of gifts, inheritances, or marriage in building their personal fortune than on entrepreneurship and self-employment. (source)
Conversely, self-made millionaires emphasized the significance of entrepreneurship and self-employment in growing their wealth over gifts or inheritances.
35. The development of a typical personality profile for millionaires revealed that they tend to exhibit high levels of extraversion, conscientiousness, openness, and narcissism while displaying lower levels of neuroticism and agreeableness. (source)
36. Millionaires tend to be more open to taking risks, more outgoing, and more conscientious, yet they are generally less prone to neuroticism compared to the average person. (source)
37. 73% of millionaires have never carried a credit card balance in their lives. (source)
38. A survey found that 94% of millionaires spend $200 or less each month at restaurants. In addition, 93% of millionaires utilize coupons at least occasionally when shopping. (source)
39. Millionaires who have earned their wealth independently typically exhibit distinct personality traits compared to those who have inherited theirs. Self-made millionaires tend to display a greater propensity for risk-taking, lower levels of neuroticism, and higher openness. (source)
Millionaire Statistics By Gender
40. There are 43,457 female ultra-high-net-worth individuals. That is women whose individual wealth is U.S. $30m or more. (source)
41. In 2022, out of the 3,194 billionaires globally, only 399, or 12.5%, were women. (source)
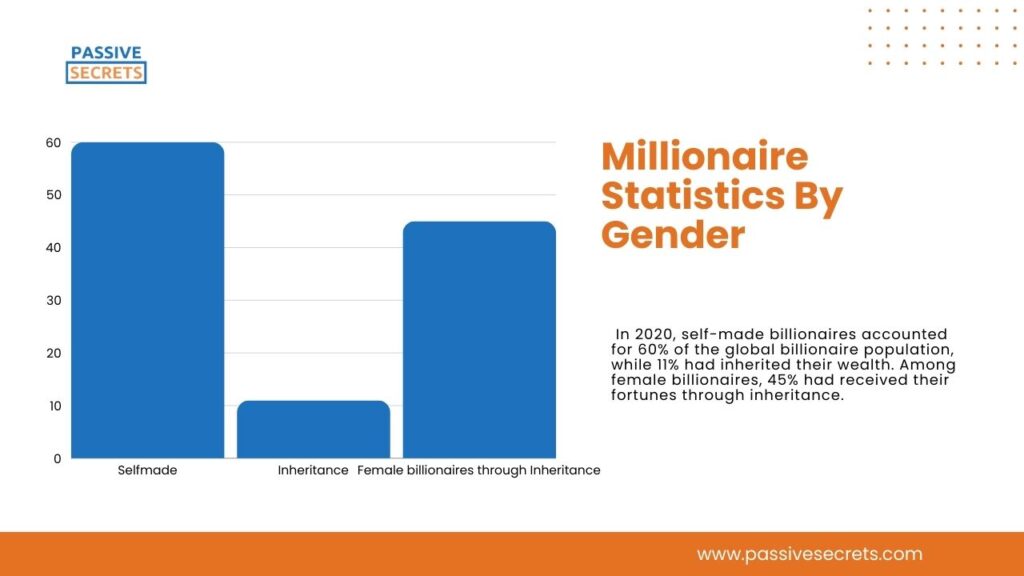
42. In 2020, self-made billionaires accounted for 60% of the global billionaire population, while 11% had inherited their wealth. Among female billionaires, 45% had received their fortunes through inheritance. (source)

Millionaire Statistics By Industry
43. The finance and investments industry is recognized as producing the highest number of billionaires globally, with 371 individuals, which represents approximately 13% of the total list. (source)
44. The manufacturing industry emerged as the third largest sector for creating billionaires, boasting 331 individuals, with 155 originating from China. (source)
45. Despite the quarantine in 2020, the fashion and retail sector managed to produce approximately 274 billionaires, making up 10% of the entire list. (source)
46. In 2022, the banking and finance sector was the primary focus of the world’s billionaires, regardless of age. Additionally, 20% of billionaires under the age of 50 spent most of their time in the technology industry. (source)
47. From April to July 2020, billionaires in the health sector saw their wealth grow by 36.3%. Meanwhile, those in the industrial and technology sectors experienced wealth increases of over 40%. (source)
Millionaire Statistics Based on Choice of University
48. Studies indicate that approximately 24.9%, or nearly a quarter, of the world’s centi-millionaires attended just 20 universities. (source)
49. Top American universities make up 16.6% of the world’s population of centimillionaires, with three Ivy League schools—Harvard (3.8%), Stanford (2.2%), and the University of Pennsylvania (1.9%)—at the forefront. (source)
50. In the Top 10 global college rankings, the United States boasts seven institutions. Of these, 1.7% of the world’s centi-millionaires are alumni of both Yale University and Columbia University, with Columbia producing 1.4% and Princeton University accounting for 1.2% of these wealthy graduates. (source)
51. The UK boasts four universities ranked in the top 20 globally, including two in the top 10, which together have produced 4.4% of the world’s centimillionaires. (source)
52. Approximately 1.7% of the world’s centimillionaires have attended the University of Oxford, while the University of Cambridge has educated 1.4% of global centimillionaires. (source)
53. 2 London Universities make it into the Top 20 Universities of centimillionaires: London School of Economics (0.8%)and London Business School (0.6%). (source)
54. France hosts two universities within the Top 20 globally, and their alumni constitute 1.5% of the world’s centimillionaires. (source)
55. China is home to two universities in the global top 20, located in Beijing, which together have produced 1.5% of the world’s centimillionaires. (source)
56. Beyond the USA, UK, France, and China, Japan is the only additional country that has a university ranked in the Top 20, specifically the University of Tokyo. (source)
57. Studies indicate that 36% of leading global CEOs have pursued education abroad, while 66% hold a master’s degree or doctorate. This suggests that an individual’s international educational experience can significantly impact their earning capacity. (source)

Top 10% and 1% Millionaire Statistics
58. UBS, a Swiss bank, reports a small decline in global wealth inequality. The proportion of wealth owned by the top 1 percent of the richest individuals decreased to 44.5% in 2022, down from 45.6% in 2021. (source)
59. In 2021, the highest wage increases were observed among the wealthiest earners, with the top 1% seeing a 9.4% rise and the top 0.1% experiencing an 18.5% increase. (source)
Meanwhile, the bottom 90% of earners witnessed a slight decline in their real earnings by 0.2% from 2020 to 2021. Additionally, those between the 90th and 99th earnings percentiles also faced decreases in their real wages during the same period.
60. In 2021, the highest-earning 1% received 14.6% of all wages, a significant increase from their 7.3% share in 1979. (source)
Conversely, the lowest-earning 90% took home only 58.6% of all wages, marking the smallest share ever recorded and a substantial drop from their 69.8% share in 1979.
61. Between 1979 and 2021, wages for the top 1% and top 0.1% surged by 206.3% and 465.1%, respectively. In contrast, the bottom 90% saw only a 28.7% increase in their wages. (source)
62. Between 1979 and 2021, the annual wage growth for the bottom 90% was just 0.6%, while wages for the top 1% and top 0.1% grew at annual rates of 2.7% and 4.2%, respectively. (source)
63. There are some strategies, such as investing, tax planning, and estate planning, that the top 10% and 1% of millionaires use to stay financially fit. These options can be easily accessed through the help of a financial trainer. (source)
64. Wage data indicates that annual earnings for the top 1% remained almost unchanged, increasing by only 0.2%, whereas wages for the bottom 90% experienced an average rise of 1.4%. (source)
65. Since 1979, over the past forty years, individuals in the top 1% have experienced a 157.8% increase in their wages, while the top 0.1% have seen their wages rise even more sharply by 340.7%. Meanwhile, the wages of the bottom 90% have grown by only 23.9% during the same period. (source)
66. The difference in wage increases highlights a significant, ongoing growth in the proportion of total wages received by the top 1.0% and 0.1% earners. (source)
Millionaire Statistics by Region
67. North America and China were the primary contributors to the increase in global wealth, with North America responsible for just over half and China contributing an additional quarter. The combined increase from other regions, including Africa, Europe, India, and Latin America, made up only 11.1% of the global wealth growth. (source)
68. There are almost 24.5 million millionaires in the United States today. (source)
69. The United States increased its household wealth by $19.5 trillion, while China’s household wealth grew by $11.2 trillion. (source)
70. Studies indicate that countries where the wealth per adult exceeds $100,000 are predominantly located in North America and Western Europe. (source)
Other wealthy regions include East Asia, the Pacific, and the Middle East.
71. The millionaire population in Africa is expected to increase by 65% over the next 10 years. (source)
72. There are about 135,200 millionaires in Africa. (source)
73. South Africa, Egypt, Nigeria, Kenya, and Morocco are Africa’s ‘Big 5’ wealth markets, accounting for 56% of the continent’s millionaires and more than 90% of its billionaires. (source)
74. South Africa has more HNWIs than any other African country, with 37,400 millionaires, 102 centi-millionaires, and 5 billionaires. Egypt is in second place, with 15,600 millionaires, 52 centi-millionaires, and 7 billionaires. (source)
Nigeria ranks third with 8,200 HNWIs, followed by Kenya (7,200 millionaires), Morocco (6,800), Mauritius (5,100), Algeria (2,800), Ethiopia (2,700), Ghana (2,700), and Namibia (2,300), all of whom are in Africa’s top ten wealthiest countries.
75. Mauritius, Namibia, Morocco, Zambia, Kenya, Uganda, and Rwanda are all anticipated to see more than 80% millionaire increase in the following decade (2033). (source)
76. Johannesburg is Africa’s wealthiest city, with 12,300 millionaires, 25 centimillionaires, and two billionaires. (source)
Cape Town is close behind with 7,400 millionaires, 28 centimillionaires, and one billionaire. Cairo (7,200 millionaires), Nairobi (4,400), and Lagos (4,200) are other significant metropolitan wealth hubs.
77. In 2020, New Jersey had the highest percentage of millionaire households in the United States, with 9.76% of its households possessing assets over $1 million. (source)
78. In 2020, the United States was responsible for almost one-third of the global increase of 5.2 million new millionaires, contributing an additional 1.7 million to its total of approximately 22 million millionaires. (source)
79. In 2022, the United States had the highest number of dollar millionaires, totaling 22.7 million, which is 6.7% of its population. Following the U.S., China ranks second with 6.2 million millionaires, accounting for 0.4% of its population, and France is in third place with 2.8 million, making up 4.2% of its population. (source)
80. In 2020, approximately 6.98 million people in North America possessed financial assets of at least $1 million, marking an increase of 2.67 million from 2008. (source)
81. In 2021, North America was home to approximately 7.4 million high-net-worth individuals, defined as those possessing financial assets of $1 million or more. (source)
82. In 2022, Iceland had the highest proportion of millionaires globally, with over 20% of its adult population possessing assets exceeding $1 million. Luxembourg was second, where 16% of its residents were millionaires. (source)
83. In 2020, California led the United States in the number of millionaire households, boasting 1.14 million households possessing at least one million dollars in investable assets. This figure is almost twice as high as Texas, which ranks second with 650,216 millionaire households. (source)
84. As of March 2022, California topped the list of U.S. states with the highest number of billionaires, housing 186. Following it was New York, with 135 billionaires, significantly more than Florida, which came in third with 78. (source)
Households Millionaire Statistics
85. Between the end of 2020 and the end of 2021, the number of U.S. households worth between $1 million and $5 million rose by 8.1%, climbing from 11.6 million to 12.55 million. This represents a growth of 950,000 millionaire households during that period. (source)
86. From the end of 2020 to the end of 2021, the count of American households worth over $25 million grew from 214,000 to 252,000. This represents a 17.8% rise in the wealthiest Americans during 2021. (source)
87. The market for ultra-high-net-worth individuals (with assets ranging from $5 million to $25 million) grew from 1,630,000 to 1,800,000. This represents a 10.4% increase between December 2020 and December 2021. (source)
88. By the close of 2020, there were 32.3 million mass affluent households possessing a net worth ranging from $100,000 to $1 million. This figure rose to 33.1 million in 2021, driven by favorable market conditions. (source)
89. In 2021, total household wealth increased by 9.8%, while average household wealth rose by 8.4%. These increases were largely attributed to the appreciation of the U.S. dollar during that year. (source)
90. This data shows the U.S. states with the smallest proportion of millionaire households relative to their population in 2019. That year, Mississippi recorded the nation’s lowest percentage, with only 4.18% of its households possessing assets exceeding $1 million. (source)
Frequently Asked Questions
1. How many millionaires are there in the United States?
The United States has roughly 23.6 million millionaires (those with a net worth of at least $1 million).
2. What percentage of the world’s adult population are millionaires?
About 0.8% of the world’s adult population (roughly 44 million people) qualify as millionaires.
3. What sector has the most millionaires?
The finance sector had the highest number of millionaires, with about 17% of people being millionaires.
4. How old is the average millionaire?
The average age of millionaires is 61 years old, which is higher than the average age of the general population.
Conclusion
The world of millionaires in 2024 is an exciting mix of old and new money, self-made and inherited wealth, with a wide range of spending habits and demographics.
Whether you’re a would-be millionaire dreaming of your own riches or just curious about the lifestyles of the elite, these statistics offer a glimpse into the world of the super-rich.
This is why exploring the mysterious and often extravagant world of the millionaires is important sometimes.

Other Interesting Statistics Posts to Check Out:
- Incredible Women in Leadership Statistics: Insights into Global Gender Representation
- Billionaire Statistics: Surprising Insights About The World’s Wealthiest
- 89 Business Loan Statistics Every Entrepreneur Should Know
- 70+ AI in Education Statistics That Prove the Future Is Already Here
- Soft Skills Statistics: Key Data on Demand, Training, and Impact
- 95+ Fascinating Gift Industry Statistics to Surprise and Delight
- Top Business Coaching Statistics & Trends Every Leader Should Know
- How Much Are People Saving? Key Personal Savings Statistics Explained
- 40+ Useful Procrastination Statistics To Help You
- 50+ Latest Life Coaching Statistics And Huge Trends
- 30+ Useful Real Estate Photography Statistics and Trends You Need to Know
- Data-Driven Decision-Making Statistics: Trends, Benefits & Challenges
- 54 Incredible Goal-Setting Statistics To Help You
- 45+ Interesting Communication Skills Statistics & Huge Trends
- Body Language Statistics & Fun Facts To Boost Your Communication Skills
- 35 Interesting Public Speaking Fear Statistics & Fun Facts
- 25+ Most Interesting Emotional Intelligence Statistics & Fun Facts

