
Are you curious about how your savings habits stack up against others? With the evolving global economy, personal savings have become a cornerstone of financial health and stability.
However, saving patterns vary widely across demographics, regions, and economic circumstances.
While some people may manage to build big savings and investments, others struggle to set aside even a small portion of their income.
These personal saving statistics reveal fascinating insights into the financial habits of individuals across the globe. In this article, we’ll uncover interesting statistics and facts that will inspire you to take control of your financial future.
Top Personal Savings Statistics (Editor’s Pick)
- The personal finance app market is projected to triple from $1.24 billion in 2023 to $3.15 billion by 2032.
- The US personal saving rate dropped to 2.9% in 2024, compared to 4.51 in 2023.
- Japan’s personal savings rate averaged 3.89% from 1994 to 2024.
- Australia’s personal savings rate averaged 9.29% from 1959 to 2024, ranging from a high of 24.1% in Q2 2020 to a low of -2.4% in Q2 2006.
- 50% of women and 47% of men aged 55-66 have no personal retirement savings.
- Men are more likely to have substantial retirement savings, with 30% having $100,000 or more, compared to 22% of women.
- Germans’ top savings goals are Retirement provision (57.5%), Consumption (44.7%), and Homeownership (43%).
General Personal Savings Statistics
1. Households’ Total Disposable Income (TDI) increased by 6% year-over-year in Q2 2024 but decreased by 1% quarter-over-quarter after adjusting for seasonal factors. (source)
2. The personal finance software market is booming, growing from $1.73 billion in 2023 to $1.85 billion in 2024, and is expected to continue expanding to $2.44 billion by 2028, with a consistent 7.1% annual growth rate. (source)
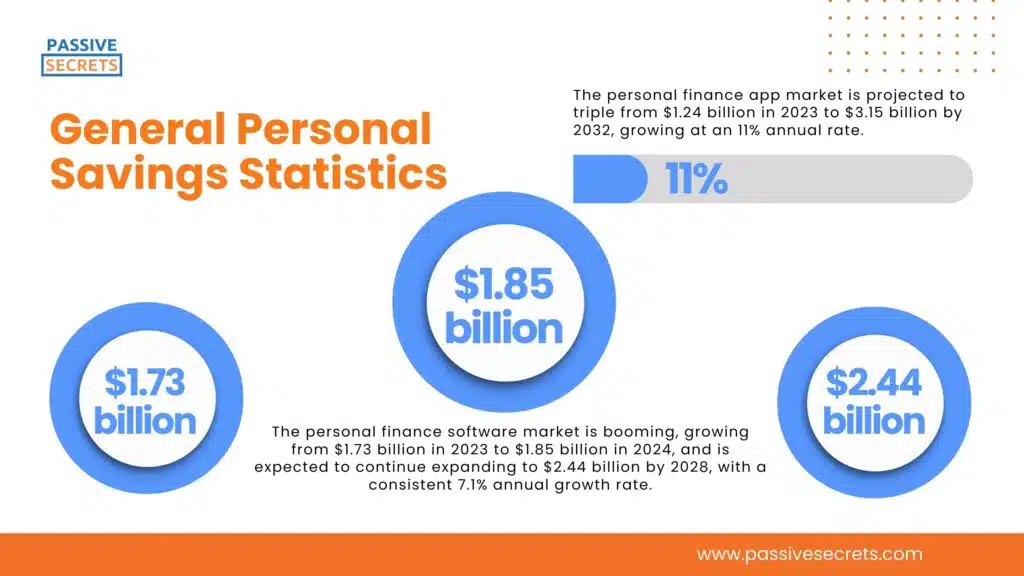
3. The personal finance app market is projected to triple from $1.24 billion in 2023 to $3.15 billion by 2032, growing at an 11% annual rate. (source)
4. In September 2024, global inflation rates dropped significantly, thanks to central banks’ efforts to raise interest rates. Russia has the highest interest rate at 19%, while Japan has the lowest at 0.25%. (source)
China’s inflation rate fell to 0.4%, the lowest among major economies, while Russia’s remained high at 8.6%.
Personal Savings Statistics by Country
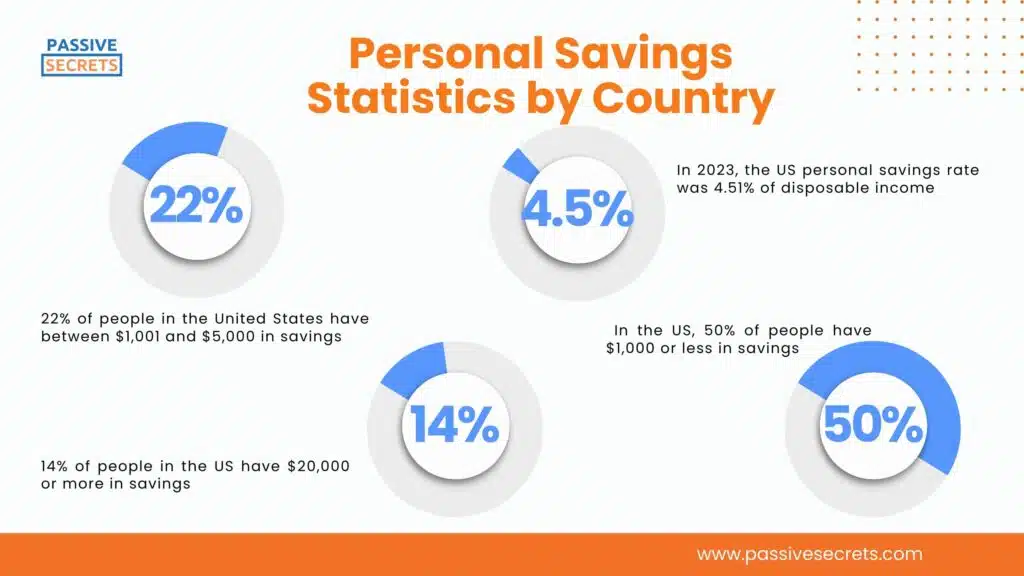
5. In 2023, the US personal savings rate was 4.51% of disposable income, down from a peak of 15% in 2020 when COVID-19 restrictions limited spending and boosted savings. (source)
6. The US gross personal savings reached $5.5 trillion in 2023. (source)
7. US personal savings jumped to $911 billion in 2023, a substantial increase from the previous year. (source)
8. The US personal saving rate dropped to 2.9% in 2024, down 1.5 percentage points from last year, calculated as the ratio of personal savings to disposable income. (source)
9. In the US, 50% of people have $1,000 or less in savings, while 14% have $20,000 or more, and 22% have between $1,001 and $5,000. (source)
10. As of May 2024, BrioDirect and TAB Bank offered the highest savings account interest rates in the US, while major banks like Goldman Sachs, American Express, and Barclays offered lower rates. (source)
11. In the US, 44% of individuals reported they could cover a $1,000 emergency expense using their savings, while 25% would need to rely on credit cards or personal loans to meet the unexpected cost. (source)
12. As of September 2024, the U.S. personal saving rate is 4.6%. In August, it was 4.8%. (source)
13. The euro area’s household saving rate rose to 15.7% in Q2 2024 from 15.2% in Q1. This increase is driven by a 0.8% increase in disposable income, outpacing a 0.2% rise in consumption. (source)
14. UK households were expected to see a 0.5-point drop in their savings rate in 2024 compared to 2022. This reverses the pandemic-driven peak of 13.75% in 2020, with rates now forecasted to fall below 5% from 2022 onwards. (source)
15. In Q2 2024, the household saving rate rose to 15.6% in the euro area and to 14.8% in the European Union. This indicates an increase in savings across both regions. (source)
16. The US personal savings rate averaged 8.44% from 1959 to 2024, ranging from a high of 32% in 2020 to a low of 1.4% in 2005. (source)
17. The Eurozone household saving rate peaked at 18.5% in 2020 during the pandemic, after rising from 11.6% in 2017, and then decreased in 2023. (source)
18. In 2025, the Euro area’s household savings rate is expected to stay below 8% of disposable income, resuming the pre-pandemic trend. Except for a brief surge in 2020 and 2021, when savings skyrocketed due to COVID-19, the savings rate has generally remained under 8% over the past decade. (source)
19. In the final quarter of 2022, Dutch households set aside approximately 18% of their disposable income as savings. (source)
20. In 2020, India’s gross domestic savings totaled $743.59 billion, while Nepal’s gross domestic savings were significantly lower, at $2.13 billion. (source)
21. Japan’s personal savings rate averaged 3.89% from 1994 to 2024, ranging from a high of 23.4% in Q4 1994 to a low of -11% in Q1 2014. (source)
22. In Q2 2024, the household saving rate in the European Union dropped to 12.7% from 14.6% in Q1 after seasonal adjustment. Before adjustments, households saved €6.6 billion out of €44.1 billion in disposable income. (source)
23. Australia’s personal savings rate averaged 9.29% from 1959 to 2024, ranging from a high of 24.1% in Q2 2020 to a low of -2.4% in Q2 2006. Meanwhile, the household saving rate remained steady at 0.6% in Q2 2024, unchanged from the previous quarter. (source)
24. Japan’s household saving ratio was approximately 0.1% in 2023, a significant drop from the multi-decade high reached in 2020, which measures the proportion of savings to disposable income. (source)
25. In Japan, the household saving ratio stood at 3.7% in Q2 2024, a significant decline from its peak of 21.1% in Q2 2020, when the COVID-19 pandemic sparked a surge in savings. (source)
26. India’s Gross Savings Rate remained unchanged at 30.2% in March 2023, the same as the previous year. (source)
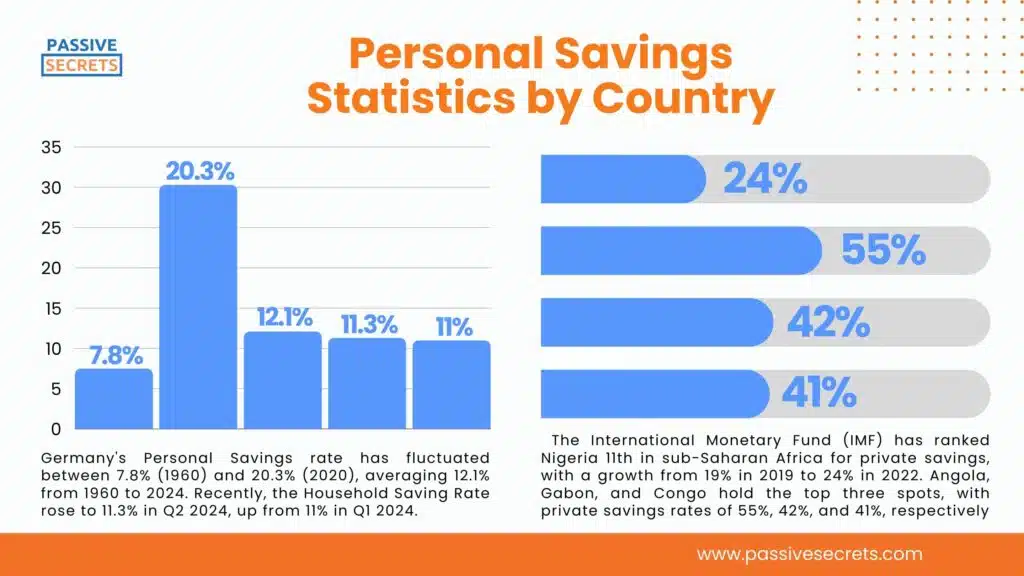
27. Germany’s Personal Savings rate has fluctuated between 7.8% (1960) and 20.3% (2020), averaging 12.1% from 1960 to 2024. Recently, the Household Saving Rate rose to 11.3% in Q2 2024, up from 11% in Q1 2024. (source)
28. According to the Reserve Bank of India, India’s net household savings have plummeted to their lowest level in 47 years. (source)
29. Canadian households saw a significant surge in savings during the COVID-19 pandemic, with a peak savings rate of 26.5% in Q2 2020. Still, by Q2 2022, the savings rate had dropped to an average of 6.2% of disposable income. (source)
30. Canada’s Personal Savings rate has fluctuated between -0.1% (2018) and 26.5% (2020), averaging 7.7% from 1961 to 2024. Recently, the Household Saving Rate rose to 6.9% in Q1 2024, up from 6.2% in Q4 2023. (source)
31. In a 2022 survey about the impact of COVID-19 in India, around 40% of the respondents cited a drop in the total household savings. However, about 34% of respondents revealed an increase in savings. (source)
32. Nigeria’s Gross Savings Rate remained unchanged at 34.6% in December 2023, the same as the previous year. (source)
33. The International Monetary Fund (IMF) has ranked Nigeria 11th in sub-Saharan Africa for private savings, with a growth from 19% in 2019 to 24% in 2022. Angola, Gabon, and Congo hold the top three spots, with private savings rates of 55%, 42%, and 41%, respectively. (source)
34. South Africa’s Household Saving Rate fell to -1.1% in Q4 2023 from -1% in Q3 2023. Historically, Personal Savings in South Africa has ranged from 23.8% (1972) to -2.4% (2007), averaging 4.42% from 1960 to 2023. (source)
35. The private household saving rate in Germany was approximately 11.3% in 2023, which is a slight increase from the previous year. (source)
Challenges in Personal Savings
36. In 2023, more than 10% of Americans were certain they would outlive their retirement savings. Although the proportion of people very likely to outlive their savings decreased slightly from 2021 to 2023, those absolutely sure they would outlive their savings increased by the same margin during that time. (source)
37. US adults cite inflation as a top reason for not growing their emergency savings, along with excessive expenses (38%) and high debt levels (21%) as additional barriers. (source)
Demographic Factors and Personal Savings
38. 59% of US households managed to save money, but a significant ethnic disparity exists. White non-Hispanic households led the way, with 60.2% saving, whereas Hispanic or Latino households lagged behind, with only 40.3% able to set aside funds. (source)
39. Over 50% of Italians find it manageable to save money without significant sacrifices. Meanwhile, 34% considered saving essential for their peace of mind, and 7% preferred not to worry about the future and didn’t prioritize saving. (source)
40. A recent Southeast Asian survey found that 40% of respondents used the Internet to learn personal finance management, while 25% had no personal finance education at all. (source)
41. In 2022, a significant gender disparity in savings emerged, with women saving an average of $3,146 per year compared to men, who saved an average of $7,007 per year, a difference of nearly $3,861. (source)
42. According to World Bank data, a gender gap in savings is evident in Nigeria, where 57.36% of men reported saving more money in their accounts, compared to 53.64% of women. (source)
43. A slight gender gap exists in retirement savings among older adults, with 50% of women and 47% of men aged 55-66 having no personal retirement savings. (source)
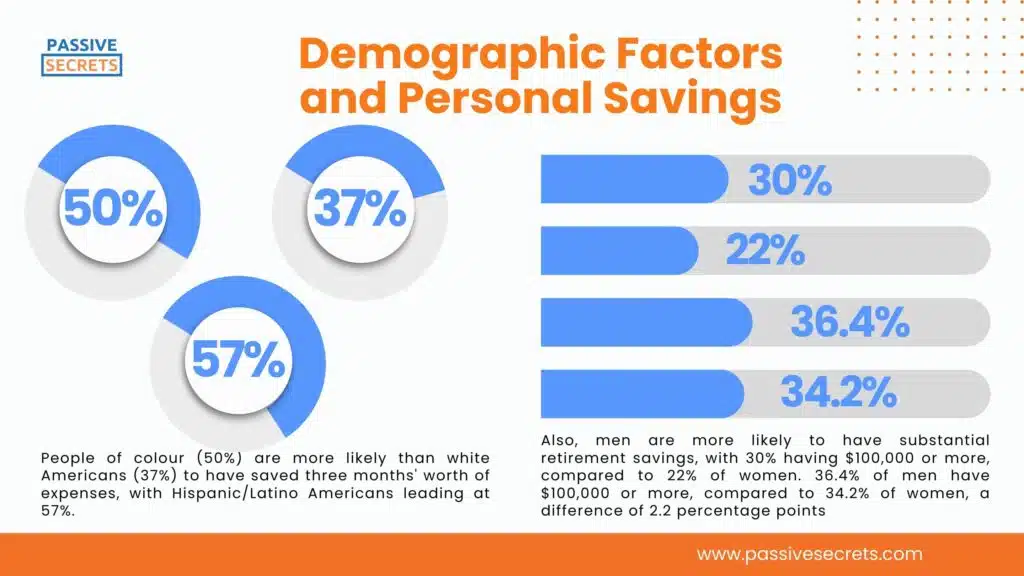
44. Also, men are more likely to have substantial retirement savings, with 30% having $100,000 or more, compared to 22% of women. 36.4% of men have $100,000 or more, compared to 34.2% of women, a difference of 2.2 percentage points. (source)
45. People of color (51%) are more likely to save over 10% of their income monthly than white Americans (34%), with Hispanic/Latino Americans leading the way and white Americans lagging behind. (source)
46. People of color (50%) are more likely than white Americans (37%) to have saved three months’ worth of expenses, with Hispanic/Latino Americans leading at 57%. (source)
Personal Savings Goals and Motivations
47. In December 2023, reducing food waste at home was the top strategy for US consumers seeking to cut food expenses and increase savings. Additionally, around 25% of consumers opted for cost-saving measures while shopping, such as purchasing affordable ingredients or cheaper meat alternatives. (source)
48. Germans’ top savings goals are Retirement provision (57.5%), Consumption (44.7%), and Homeownership (43%). These three motives dominate the savings landscape in Germany. (source)
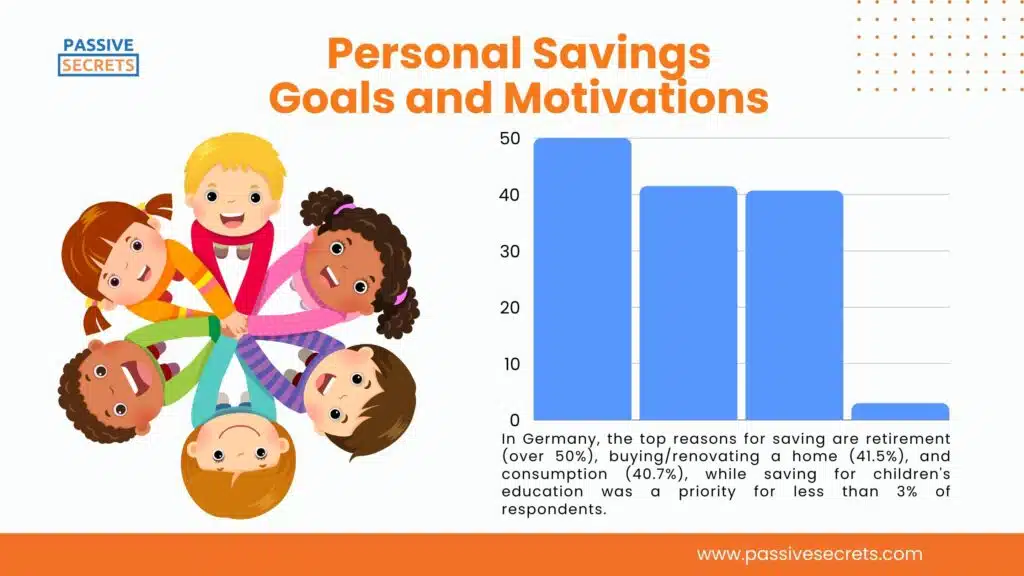
49. In Germany, the top reasons for saving are retirement (over 50%), buying/renovating a home (41.5%), and consumption (40.7%), while saving for children’s education was a priority for less than 3% of respondents. (source)
Conclusion
The statistics on personal savings reveal important trends and challenges individuals face in managing their finances. While saving rates vary widely across demographics and regions, the data underscores the importance of building financial resilience through consistent saving habits.
With rising living costs and economic uncertainties, prioritizing personal savings is more critical than ever for long-term financial security. Understanding these statistics can help individuals make informed decisions to improve their saving strategies and achieve greater financial stability.
FAQs

Other Related Statistics You Should Know:
- Incredible Women in Leadership Statistics: Insights into Global Gender Representation
- Billionaire Statistics: Surprising Insights About The World’s Wealthiest
- 89 Business Loan Statistics Every Entrepreneur Should Know
- 70+ AI in Education Statistics That Prove the Future Is Already Here
- Soft Skills Statistics: Key Data on Demand, Training, and Impact
- 95+ Fascinating Gift Industry Statistics to Surprise and Delight
- Top Business Coaching Statistics & Trends Every Leader Should Know
- 40+ Useful Procrastination Statistics To Help You
- 90 Amazing Millionaire Statistics & Facts You Dare Not Miss
- 50+ Latest Life Coaching Statistics And Huge Trends
- 30+ Useful Real Estate Photography Statistics and Trends You Need to Know
- Data-Driven Decision-Making Statistics: Trends, Benefits & Challenges
- 54 Incredible Goal-Setting Statistics To Help You
- 45+ Interesting Communication Skills Statistics & Huge Trends
- Body Language Statistics & Fun Facts To Boost Your Communication Skills
- 35 Interesting Public Speaking Fear Statistics & Fun Facts
- 25+ Most Interesting Emotional Intelligence Statistics & Fun Facts

