The film industry is a multibillion-dollar industry that has been transformed and impacted by the rise of digital technology.
It is also influenced by the emergence of streaming services and ever-changing consumer habits.
The film industry impacts markets in Asia, South America, North America, Africa, etc.
It is a major industry that is useful and entertaining to individuals and a major contributor to the economy of many regions.
Over the years, it has stood the test of time and continues to evolve through new technologies and platforms.
One significant change in the film industry in recent years is the use of AI.
AI has both positive and negative implications in the film industry, with some fearing that it could lead to a lack of creativity and diversity.
However, AI is simply used by film companies to create more engaging and relevant content.
In this article, we will carefully explore some of the key statistics and trends shaping the future of the film industry.
Key Film Industry Statistics (Editor’s Pick)
- The global movies and entertainment industry is expected to reach around $169.62 billion by 2030, at a CAGR of 7.21% between 2023 and 2030.
- The global film and video market is estimated to reach $344.84 billion by 2027.
- 50% of Gen Zers claimed that the audio/visual quality of the film was a major determinant in their going to the movies.
- Belgium has the highest percentage of co-productions, with 72% of their films being made in partnership with another country
- In the United States and Canada, romantic comedies accounted for at least 4% of box office revenue.
- China is the 2nd largest film market in the world with 1082 movies produced in 2018.
- The revenue from the Asian Cinema market is expected to reach $32.52 billion in 2024.
- The number of users in the Asian Cinema market is expected to rise to 1.1 billion by 2029.
- Cinema attendance in the EU and UK increased by 63% from 403 million tickets sold in 2021 to an estimated 657 million tickets in 2022.
- The box office revenue from Europe, the Middle East, and Africa amounted to $10.9 billion, more than half of the global box office revenue of $21.3 billion.
- France’s box-office revenue for 2022 came to 1.1 billion euros, a 62.7% increase from about 673 million euros the year before
- North America is the largest region in the film and video market.
- Overall box office revenue in the United States and Canada was roughly 8.91 billion dollars.
- In 2022, Mexico had the highest box office revenue in Latin America.
- Ghana’s box office revenue is expected to remain steady at $1.1 million from 2018 to 2023.
- In 2021, 103 titles released in movies across Liberia, Ghana and Nigeria were produced by Nollywood.
- 38% of respondents supported the use of AI to generate voices for animated characters.
- 22% of men and 14% of women believed that AI could have a somewhat positive effect on the film industry.
General Film Industry Statistics
1. The global movies and entertainment industry was valued at approximately $94.45 billion in 2022. (source)
It is expected to increase to around $169.62 billion by 2030, with a compound annual growth rate (CAGR) of approximately 7.21% between 2023 and 2030.
2. China, North America (which includes the United States and Canada), and Japan were the world’s leading box office markets by revenue in 2021. (source)
3. Regarding film revenue, the United States was the global leader in 2021, generating around $24 billion. (source)
China and Japan were the second and third largest markets, respectively, with China generating approximately $12 billion and Japan $3.6 billion.
4. By 2022, the global film industry was projected to reach $76.7 billion in revenue while employing 389,000 people at 57,000 businesses worldwide. (source)
5. The markets in Indonesia and India are projected to increase by 293% and 231%, respectively. (source)
6. The revenue of the theatrical market in 60 economies was about U.S. $11.9 billion in 2020, down 71% from 2019. (source)
This decrease was likely due to the COVID-19 pandemic, which caused many cinemas to close temporarily and reduced the number of people going to the movies.
7. The top 3 movies with the most Oscar nominations and wins are; “Titanic(1997)”, “All About Eve (1950)” and “La la Land(2016)”. (source)
These three movies received 14 nominations, with the first receiving 11 awards and the last 2 receiving six awards.
8. The film and Video Global market has an expected growth rate of 5.0% through to 2027. (source)
9. The global film and video market is estimated to reach $344.84 billion by 2027. (source)
10. The film and video market size increased from $285.62 billion to $304.17 billion in 2024 at a compound annual growth rate (CAGR) of 6.5%. (source)
11. The film and video market size is estimated to grow to $390.76 billion in 2028 at a compound annual growth rate (CAGR) of 6.5%. (source)
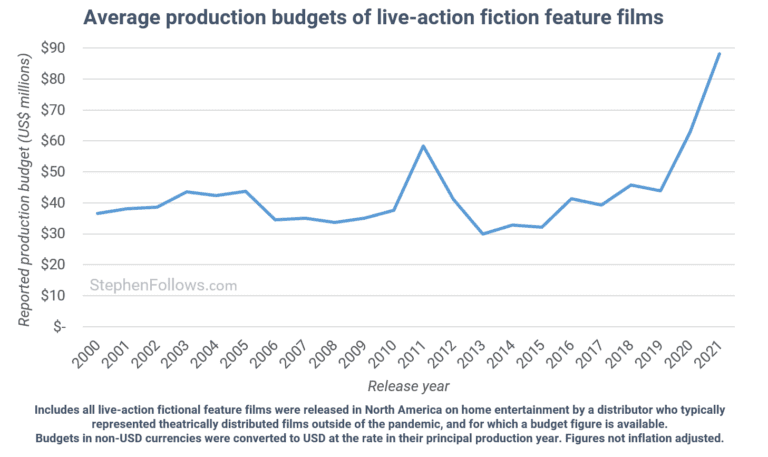
12. The average budget for producing live-action feature films increased from around $38 million in 2000 to $87 million in 2021. (source)

13. According to research, countries that have produced the sweatiest movies include Ireland, the UK, Australia, Canada, and the USA. (source)
14. Almost 71% of 553 Thai movies use at least one swear word, and an average Irish film has about 26.6 swear words. (source)
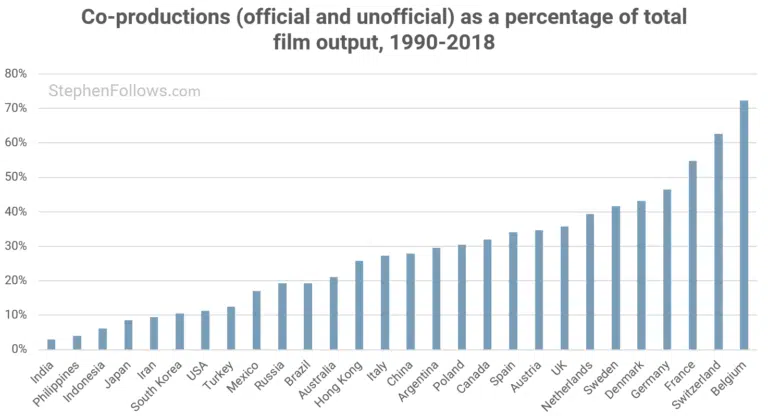
15. Belgium has the highest percentage of co-productions, with 72% of their films being made in partnership with another country. (source)

16. Among the countries with the lowest levels of co-production, India has 3%, the Philippines has 4% and Indonesia has 6%. (source)
17. The three most-viewed foreign movies in Spain ever produced were “Titanic,” “Avatar,” and “E.T. the Extra-Terrestrial”. (source)
18. 61% of Gen Zers in the United States stated that the films available in theaters were a very important factor when considering whether or not to go to the movies. (source)
19. 50% of Gen Zers claimed that the audio/visual quality of the film was a major determinant in their going to the movies. (source)
20. 48% of Gen Zers claimed that the quality of the movie tickets was an important factor when they were considering going to the movies. (source)
Box Office Statistics
21. In 2021, global box office revenue was roughly U.S. $21.3 billion, with Asia Pacific accounting for more than half (10.9 billion USD). (source)
Box office revenue in Europe, the Middle East, and Africa (EMEA) totalled $5 billion, accounting for over one-fourth of the total.
22. In 2022, India’s box offices sold over 981 million movie tickets. The figure exceeds those of China, the United States, Mexico, and Japan combined. (source)
23. The box office revenue in Nigeria was expected to grow from $12 million in 2017 to $17 million in 2023. (source)
24. In the United States and Canada, romantic comedies accounted for at least 4% of box office revenue. (source)
25. The movie “Barbie” was the highest-grossing movie at the box office in the US and Canada in 2023, bringing in a domestic revenue of about $636.23 million. (source)
26. The box office revenue generated by 3D films in the US and Canada decreased from $2.2 billion in 2010 to $1.3 billion in 2017. (source)
27. In 2021, global box office revenues reached $21.3 billion, with $10.9 billion coming from the Asia Pacific region. (source)
28. After the COVID pandemic, worldwide box office revenues decreased from $44.5 billion in 2019 to $16.5 billion in 2020. (source)
29. As of March 2020, global box office revenue was estimated to be at about $32.3 billion. (source)
Film Industry Statistics by Region
Asia Film Industry Statistics
30. Asian countries such as India, China, Japan, and South Korea are known as the top movie producers in the world. (source)
Of these countries, China is known to have generated over $7 billion as of 2021.
31. China is the 2nd largest film market in the world with 1082 movies produced in 2018. This number is a rise from the 526 movies produced in 2010. (source)
32. The revenue from the Asian Cinema market is expected to reach $32.52 billion in 2024. (source)
The revenue is also expected to grow at a CAGR of 5.81%, reaching $43.14 billion by 2029.
33. The number of users in the Asian Cinema market is expected to rise to 1.1 billion by 2029. (source)
34. In 2021, Asia-Pacific’s box office grew by 48.2% from the previous year. (source)
Movie theatre revenue was $8.76 billion that year, with a majority ($6.76 billion) coming from China alone.
35. The Battle at Lake Changjin is the highest-grossing movie of all time in China. (source)
The three-hour movie, which reached 5.78 billion yuan, is one of the most expensive movies ever made in China. Wolf Warriors 2 is the second highest-grossing Chinese movie of all time, reaching 5.69 billion yuan.
36. Approximately 1.3 billion tickets were sold in Chinese theatres in 2023, accounting for almost 76% of the total quantity sold in 2019 before the pandemic. (source)
37. Through 2022, nearly 981 million movie tickets were sold at Indian theaters. This number exceeded the combined figures for China, the United States, Mexico, and Japan. (source)

Europe Film Industry Statistics
38. European films sold an estimated 185 million tickets, which is 77 million more tickets than in 2021 and about 69% of the pre-pandemic average admissions level from 2014 to 2019. (source)
39. An estimated total of 1960 feature films were produced in the EU and the UK in 2022. (source)
This showed an increase of 194 films from 2021 and also represents the 2nd highest production recorded.
40. Feature documentaries, increased by 116 films to a total of 771 feature documentaries. Fiction films also increased by 78 films to a total of 1189 films. (source)
41. In 2022, 13 films sold more than 10 million tickets in the EU and the UK, compared to 5 films in 2021 and 18 films in 2019. (source)
42. In 2021, cinema attendance in Norway grew by 55%, reaching about 75% of the 2019 average cinema attendance. (source)
43. The Turkish theatrical market grew strongly every year but only reached 53% of its pre-pandemic admission levels. (source)
44. Cinema attendance in the EU and UK increased by 63% from 403 million tickets sold in 2021 to an estimated 657 million tickets in 2022. (source)
45. The market share for European films increased from 26.8% in 2021 to 28.4% in 2022. (source)
46. Gross box office in the EU and the UK grew by 70% in 2022 compared with 2021 which increased from 3.0 billion euros to 5.1 billion euros. (source)
47. Top Gun: Maverick (US), Avatar: The Way of Water (US), and Minions: The Rise of Gru (US) topped the Europe 28 charts in 2022, selling 34.4 million, 30.6 million and 30.2 million tickets yearly respectively. (source)
48. The box office revenue from Europe, the Middle East, and Africa amounted to $10.9 billion which was more than half of the global box office revenue of $21.3 billion. (source)
49. In 2022, the box office revenue for Europe, the Middle East and Africa (EMEA) collectively amounted to about $7.1 billion. (source)
50. The teaser for “Spider-Man: No Way Home” (2021) surpassed all other movie trailers in terms of views in the first 24 hours of its release in February 2023. In that short amount of time, it received over 355 million views. (source)
51. In April 2022, “Thor: Love and Thunder” got up to 209 million views and was ranked among the top 10 films shown. (source)
52. In the US, the average cost of a movie ticket rose from $8.65 in 2016 to around $9.57 in 2021. (source)
This indicates a rise of around 11% throughout the previous five years.
53. Between 1995 and the beginning of 2023, adventure movies brought in almost $66 billion at the box office. Next, action films brought in almost $55 billion. (source)
54. With about $24 billion in revenue, the United States dominated the global film entertainment market in 2021. China and Japan came next, with respective revenues of almost $12 billion and $3.6 billion. (source)
55. France’s box-office revenue for 2022 came to 1.1 billion euros, a 62.7% increase from about 673 million euros the year before. (source)
56. With increases of 93.5% and 50.2%, respectively, the box office in Germany and Spain reached 722 million and 379 million euros. (source)
North America Film Industry Statistics
57. North America is the largest region in the film and video market. (source)
58. As of mid-2022, North American theatres were the highest ranked. (source)
This is because the majority of high-end motion picture films in history were either produced by or in association with US studios.
59. North America ranked the 2nd most influential movie-producing region worldwide in terms of box office gross. (source)
60. The fourth episode of the “Pirate of the Caribbean series” was the most costly production ever as of March 2024. (source)
The cost of making this Disney Studios film was approximately $378.5 million.
61. In 2023, overall box office revenue in the United States and Canada was roughly 8.91 billion dollars, up from 7.37 billion dollars in 2022. (source)
62. In 2022, 449 more movies were released in the United States and Canada than in the previous year, up from 406. (source)
63. Adventure movies were the highest-grossing movie genre at the North American box office, which includes the United States and Canada, from 1996 until early 2023. (source)
64. AMC movie theater attendance increased significantly from 2020 to 2022, from 75 million to over 200 million. (source)
65. The box office revenue in North America was up to 29% of the total global box office revenue. (source)
66. In 2023, the box office revenue across the United States and Canada increased to $8.91 billion from $7.37 billion in 2022. (source)
67. The box office revenue for the year 2022 in North America was around $4.8 billion, an increase from the $3.91 billion in 2021. (source)
68. As of March 2023, AMC Theatres was the largest theatre chain in the US and Canada, with a total of 7.71 thousand screens. (source)
South America Film Industry Statistics
69. The revenue of the filmed entertainment market in Argentina is expected to increase significantly, with a projected growth rate of over 390.0% from 2021 to 2026. (source)
70. In 2022, Mexico had the highest box office revenue in Latin America, exceeding the combined figures of Brazil and Argentina. (source)
71. In 2022, the average price for movie tickets within Latin America was the highest in Uruguay, Panama, and the Dominican Republic. (source)
In each of these countries, the figures surpassed $5.3 with Uruguay reaching about $6.
72. In 2022, more than 7.4 thousand cinema screens were active in Mexico, which was higher than in Brazil, Colombia, Argentina, Peru, and Chile markets in Latin America combined. (source)
73. Between 2021 and 2026, the filmed entertainment market in Argentina is expected to grow by over 390%. (source)
74. At the end of 2023, 7,637 cinema screens were operating in Mexico, up from 7,537 in 2022. This was an annual increase of 1.3%. (source)
75. The gross box office revenue in Latin American cinemas reached $166.4 million in 2022. (source)
76. Among the monitored markets in Latin America, Mexico, Brazil, and Argentina saw an increase in film earnings. (source)
Mexico earned the highest revenue, $114.8 million, followed by Brazil, $87.3 million, and Argentina, $6.2 million.
77. Fantastic Beasts: The Secrets of Dumbledore and The Batman were among the top three highest-grossing films in Mexico and Brazil. (source)
The film Fantastic Beasts: The Secrets of Dumbledore grossed $11 million in Mexico and $8.4 million in Brazil.
The Batman was another popular film, earning $31.8 million in Mexico and $18.2 million in Brazil.
78. Action and adventure was the highest-grossing genre in Latin America by aggregate gross box office revenue. (source)
79. Overall, Argentina’s cumulative gross box office revenue year to date stood at $6.2 million. (source)
Africa Film Industry Statistics
80. Between November 2020 and May 2021, Africa produced about 5,500 movies on average. East Africa and West Africa are the leading regions in terms of film production, with 1,500 and 3,400 movies, respectively. (source)
81. Ghana’s box office revenue is expected to remain steady at $1.1 million from 2018 to 2023. (source)
82. Nigeria generates the highest share of box office revenue in West Africa, with 96.5% in 2022 and 97% in 2021. (source)
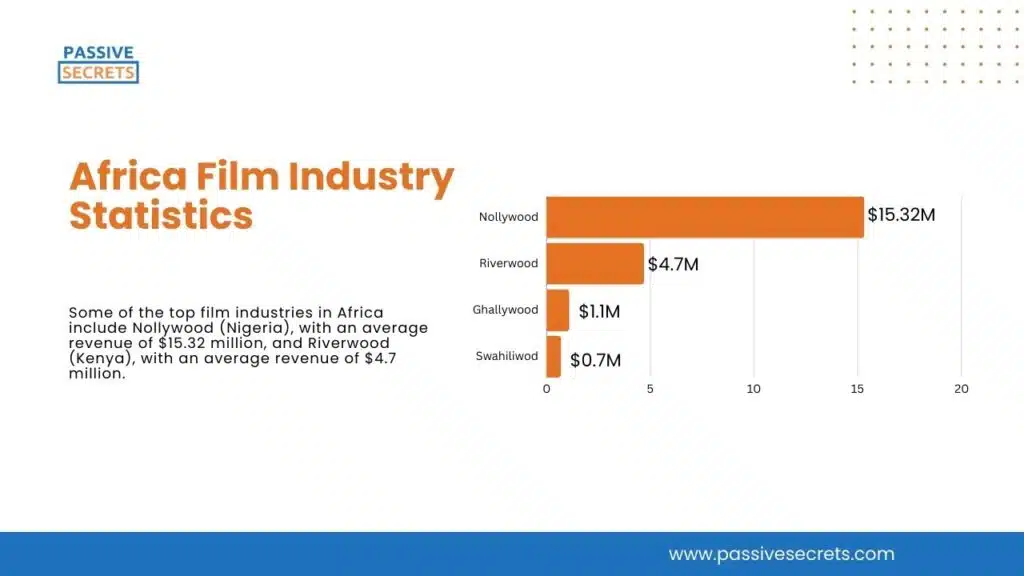
83. Some of the top film industries in Africa include Nollywood (Nigeria), with an average revenue of $15.32 million, and Riverwood (Kenya), with an average revenue of $4.7 million. (source)
84. Other film industries include Ghallywood (Ghana), with an average revenue of $1.1 million, and Swahiliwood (Swahili), with an average revenue of $0.7 million. (source)

85. Nollywood accounted for 30% of the total share of revenue generated by the total share of revenue generated by the film industry in Ghana and Nigeria. Hollywood, on the other hand, accounted for 69%. (source)
86. In 2021, 103 titles released in movies across Liberia, Ghana and Nigeria were produced by Nollywood. Hollywood added up to 65 movies while Ghallywood released 6 movies. (source)
87. Nollywood movies accounted for the largest share of revenue generated by film industries in Liberia, Ghana, and Nigeria, with 45% of the revenue. (source)
88. The advertising revenue generated by the cinema sector in Nigeria experienced an increase between 2014 and 2018. (source)
89. In 2018, the advertising revenue amounted to $700,000, a 17% increase from the previous year which generated $600,000. (source)
AI in Film Industry Statistics
90. In July 2023, a survey found that 42% of respondents supported the use of AI technology to create special effects or alter actors’ appearances. (source)
91. In the same survey, 38% of respondents supported the use of AI to generate voices for animated characters. (source)
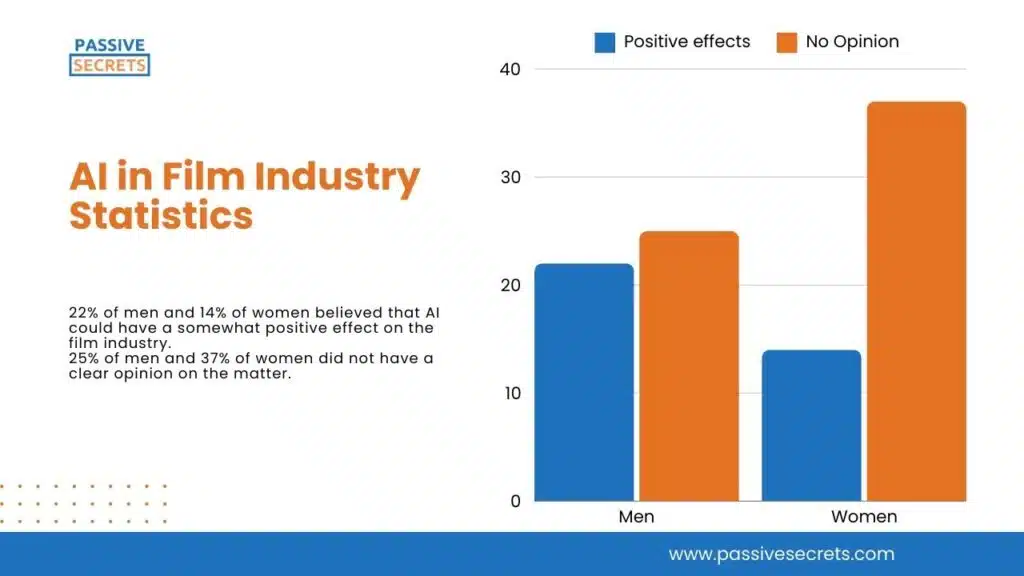
92. 22% of men and 14% of women believed that AI could have a somewhat positive effect on the film industry. (source)

25% of men and 37% of women did not have a clear opinion on the matter.
93. Big players like Netflix and Amazon are harnessing the power of big data and AI to create perfectly tailored entertainment for their subscribers. (source)
These companies can use data on viewing habits and preferences to recommend content that is specifically tailored to each individual. This allows them to create more engaging and personalized experiences for their viewers.
94. In 2016, 20th Century Fox paired up with IBM Watson and used AI to create “the perfect” movie trailer for the sci-fi horror film “Morgan”. (source)
Conclusion
The global film industry is a dynamic and rapidly changing sector driven by technology, consumer demand, and the rise of streaming services.
The film industry is constantly evolving, and it’s hard to predict what the future holds, but one thing is certain – it will continue to be a force in the entertainment world for years to come.
As such, movie producers need to pay attention to trends and consumer demands to thrive in the film industry.
These film industry statistics would be extremely helpful in discovering some of the key trends shaping the industry.
FAQs

Related Posts:
- Thought-Provoking Gender Inequality Statistics: 160+ Insights Across Regions
- 110+ Shocking Income Inequality Data You Need to Know
- 50 Interesting Sharing Economy Statistics You Need to Know
- 100+ Animation Statistics: The Ultimate Guide To The Industry’s Trends and Insights
- 80+ Franchise Statistics and Facts You Should Know In 2024
- The Future of Learning: 50+ Top EdTech Statistics For 2024
- The Web3 Statistics Report 2024: Trends, Insights, and Predictions
- Meme Statistics 2024: Facts, Trends, and Figures That Will Blow Your Mind
- 85+ MOST Interesting Anime Statistics and Facts (NEW Report)
- Board Game Statistics: Revenue, Market Size, Demographics & More
- 125+ Interesting Airbnb Statistics by Country (Deep Insights)
- 50+ Interesting Born Into Poverty Stay In Poverty Statistics
- 80+ Alarming Technology Addiction Statistics You Must Know
- 65+ Impressive Chess Statistics and Facts To Know in 2024
- Spotify Statistics: Latest Report on The Music Streaming Platform
- 50+ Useful Video Game Addiction Statistics, Facts & Huge Trends
- 50+ Vital Internet Safety Statistics & Facts You Must Know
- Internet Dangers Statistics: A Look At The Internet’s Dark Side
- 50 Interesting Bible Statistics and Facts You Didn’t Know
- 95+ Interesting Dream Statistics and Facts You Can’t Miss
- 75+ Interesting Relationship Statistics & Facts You Should Know
- Dance Statistics: A Deep Dive Into The Rhythm Of Movement
- 40+ Incredible Single Father Statistics You Have to Know
- The Battle of the Sexes: Male Vs. Female Spending Statistics
- 95+ Jaw-Dropping Period Poverty Statistics You Need To Know
- 70 Exciting Love Statistics And Facts (True Love, Intimacy, Marriage, Dating & Relationships)
- 30+ Gentle Parenting Statistics & Facts: Is This Parenting Style Worth It?
- 55+ Useful Black Consumer Spending Statistics (2024 Report)
- Holiday Spending Statistics: Valentine’s Day, Easter, Thanksgiving, & Christmas

