Making good decisions is crucial for any business or organization. But did you know that using data to guide your decisions can make all the difference?
Relying on intuition or guesswork is just not enough in business. That’s where data-driven decision-making comes in.
With the power of data, you can make informed choices that drive real results.
But just how widespread is this practice?
Let’s dive into the latest data-driven decision-making statistics to find out. From adoption rates to benefits and challenges, these numbers will give you a snapshot of the state of data-driven decision-making today.
What is Data-Driven Decision Making?
Data-driven decision-making (DDDM) uses facts, metrics, and data to guide strategic business decisions that align with your goals, objectives, and initiatives.
It involves gathering information based on your company’s key performance indicators (KPIs) and converting it into actionable insights. This technique is an essential component of modern company strategy.
Top Data-Driven Decision-Making Statistics
- Over 40% of companies globally use big data analytics, and many are now reaping various benefits from big data.
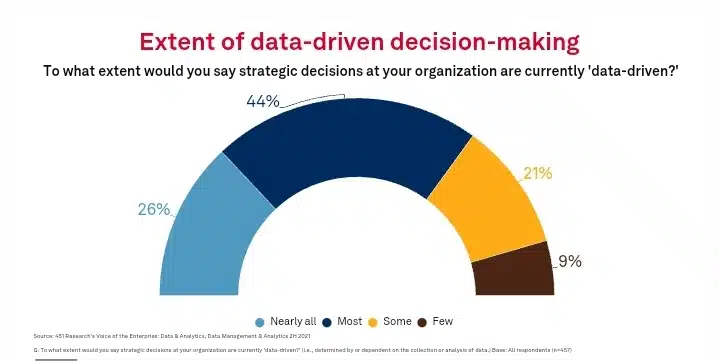
- About 25% of organizations make nearly all strategic decisions data-driven, while 44% make most decisions data-driven.
- 90% of enterprise businesses say data is becoming increasingly important to their overall business.
- 73.5% of managers and executives at data-leading companies worldwide reported that their decision-making processes are always data-driven.
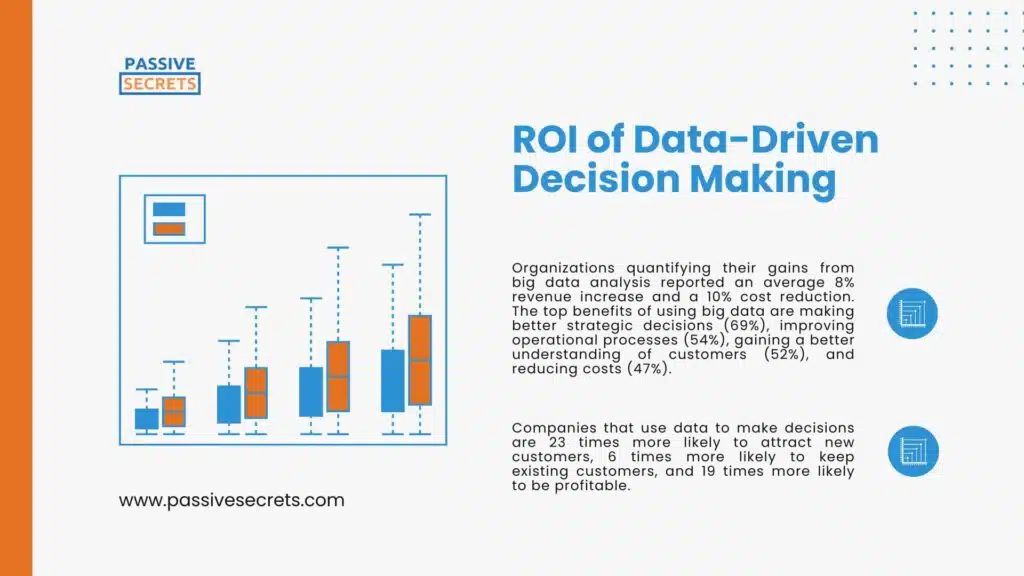
- Organizations quantifying their gains from big data analysis reported an average 8% revenue increase and a 10% cost reduction.
- 77% of data and analytics professionals prioritize data-driven decision-making in their programs.
- 85% of Singaporean business leaders experience decision distress but believe data can improve decision-making, reduce risk, and prepare for the unexpected.
- Only 46% of data and analytics professionals highly trust data used for decision-making.
- Data quality is the top concern for 70% of data professionals who struggle with trust in their data, and 53% prioritize it as the key to improving data integrity.
- Almost 8 in 10 respondents (79%) expect data to be more crucial in their organization’s decision-making processes over the next year.
- Data-driven strategies will outperform gut feelings in 65% of B2B sales organizations by 2026.
Statistics on Data-Driven Decision Making Adoption
1. According to Gartner, 90% of companies consider information and analytics crucial to their business strategy and success. (source)
2. Over 40% of companies globally use big data analytics, and many are now reaping various benefits from big data. (source)
3. Only a minority of companies (less than 50%) treat information as a valuable asset for decision-making, but a significant majority (two-thirds) expect it to become one in the future. (source)
4. Only one-third of enterprises currently use information to identify new opportunities and predict trends, with most of the remaining two-thirds planning to do so. (source)
5. Most companies use an average of 5 internal data sources to inform decision-making. (source)
6. Most companies (39%) adopt a top-down approach to decision-making, followed by 34% that use a management committee approach, while only 18% make decisions through a collaborative or democratic process. (source)
7. About 25% of organizations make nearly all strategic decisions data-driven, while 44% make most decisions data-driven. (source)
8. 90% of enterprise businesses say data is becoming increasingly important to their overall business. (source)
9. According to a survey, 73.5% of managers and executives at data-leading companies worldwide reported that their decision-making processes are always data-driven. (source)
10. In 2020, there was a 12% increase in implementing data-driven decision-making globally compared to 2018. However, despite the increase, only 50% of respondents said decision-making in their organizations is data-driven. (source)
11. In 2021, two-thirds (about 67%) of data and analytics leaders in Europe and the US reported having a corporate initiative to become more data-driven, while only 3% had no plans to implement one. (source)
12. Nearly 7 in 10 leading marketers say their companies use data to support decision-making at all levels. (source)
13. 61% of C-suite leaders admit that their companies’ decision-making processes are only slightly or rarely data-driven. (source)
14. 39% of business leaders say their company’s decision-making is highly data-driven. However, 8% of business leaders say their company’s decision-making is rarely data-driven. (source)
Industry-Wise Data-Driven Decision Making Statistics
15. Among those using or planning to use big data, 25% have integrated big data analytics into marketing and 23% into sales. (source)
16. Over two-thirds of retailers (68%) use in-store analytics solutions to enhance the shopping experience and boost their business. (source)
17. In 2020, the banking sector led in data-driven decision-making by 65%, followed by insurance and telecom. (source)
18. Global marketing decision-makers find data-driven marketing most useful in email marketing (47%) and customer experience and journey mapping (46%). (source)
19. In a 2022 survey, only 45% of commercial real estate executives collect and utilize data on office space usage. 13% collect data in real-time and use advanced analytics. The adoption of smart technology could improve real estate performance and productivity by enhancing data visibility and data-driven decision-making. (source)
Benefits and ROI of Data-Driven Decision Making
20. Less than 50% of documented corporate strategies highlight data and analytics as essential for delivering enterprise value. (source)
21. Companies that use data to make decisions are 23 times more likely to attract new customers, 6 times more likely to keep existing customers, and 19 times more likely to be profitable. (source)
22. Organizations quantifying their gains from big data analysis reported an average 8% revenue increase and a 10% cost reduction. The top benefits of using big data are making better strategic decisions (69%), improving operational processes (54%), gaining a better understanding of customers (52%), and reducing costs (47%). (source)
23. Best-in-class companies rely less on gut feelings (40%) than laggards (70%) for decision-making. (source)
24. 68% of companies that grew revenue within a year used market research to drive their success. (source)
25. 77% of data and analytics professionals prioritize data-driven decision-making in their programs. In turn, data-driven decision-making supports key goals: operational efficiency (73%), cost reduction (62%), revenue generation (59%), and regulatory compliance (57%). (source)
26. Nearly half (44%) of data leaders who implemented data programs saw positive results, and 46% reported increased demand for data, suggesting that providing high-quality data can fuel further demand and drive business success. (source)
27. Businesses using big data saw an 8–10% profit increase and a 10% cost reduction. (source)
28. Leading marketers are 1.6 times more likely to believe that open data access leads to higher performance. (source)
29. 85% of Singaporean business leaders experience decision distress but believe data can improve decision-making, reduce risk, and prepare for the unexpected. (source)
Most Common Data-Driven Decision Making Challenges
30. Half of businesses (50%) are unclear about their Data & AI needs and struggle with data complexities. (source)
31. In a survey, 58% of respondents say their companies make most decisions based on gut instinct rather than data. (source)
32. Organizations, on average, use only 50% of all available information for decision-making. But only half of the available information is used. (source)
33. Only 46% of data and analytics professionals have high trust in data used for decision-making, citing poor data quality as a major obstacle (36%), along with challenges in data integration (60%) and data integrity (50%). (source)
34. Poor data quality comes with a hefty price tag, costing organizations an average of $12.9 million per year. (source)
35. For every 10 organizations firmly embracing data-driven actions, 23 are struggling to become data-driven. (source)
36. Half of marketers struggle with targeting segmented audiences. Also, one-third of respondents mentioned real-time decision-making and maintaining quality data as top challenges for data-driven marketing. (source)
37. 86% of senior executives agree that eliminating organizational silos is critical for expanding data and analytics use in decision-making. (source)
38. Data-driven organizations see a 3x improvement in decision-making, yet 62% of executives still rely on experience and advice over data when making decisions. (source)
39. According to Qlik research, 45% of C-suite executives make decisions based on gut feeling, and 42% doubt data accuracy. (source)
40. 92% of business leaders asserted that the increasing number of data sources has limited their organizations’ progress. Also, 73% of business leaders agree that their distrust of data has prevented them from making decisions. (source)
Data-Driven Decision-Making Technology and Tool Usage
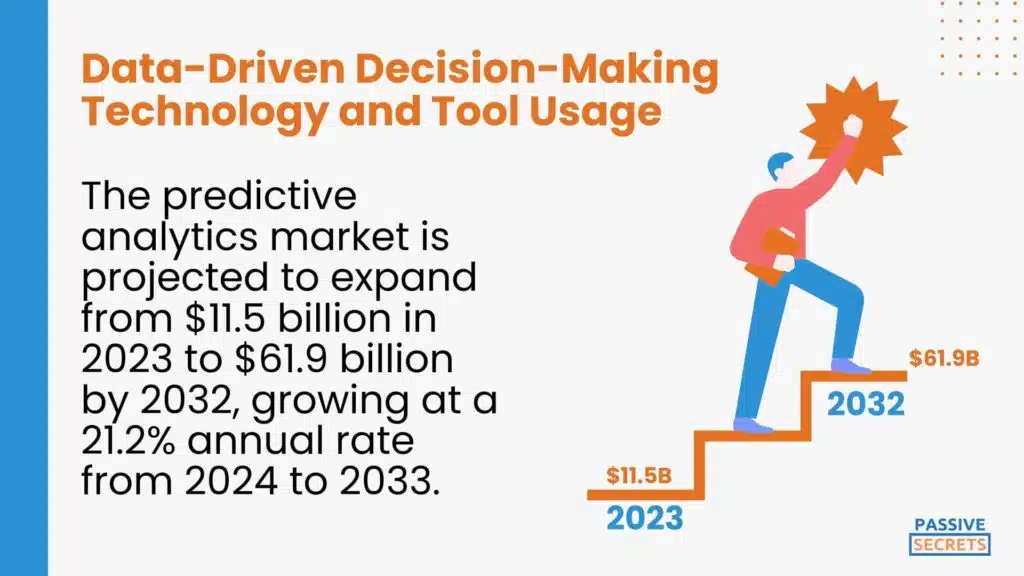
41. The predictive analytics market is projected to expand from $11.5 billion in 2023 to $61.9 billion by 2032, growing at a 21.2% annual rate from 2024 to 2033. (source)
42. Businesses using predictive data analytics reported an average revenue increase of 15%. (source)
43. 83% of enterprises believe predictive data analytics will be crucial for maintaining a competitive edge. (source)
44. Effective use of predictive analytics can increase operating margins by up to 60%. (source)
45. The global decision intelligence market was valued at USD 10.64 billion in 2022 and is projected to reach USD 36.06 billion by 2030 with a CAGR of 16.5%. (source)
46. High-performing organizations are 16x more likely to use advanced technology for risk analysis, 12x more likely to use technology to identify decision stakeholders, and 10x more likely to use digital tools for change management and execution compared to low-performing organizations. (source)
Data Quality and Governance in Data-Driven Decision Making
47. In a survey, most respondents (60%) say the finance department is key in data management and governance, while 41% say IT departments are involved. However, only 10% say IT is solely responsible. (source)
48. Data quality is the top concern for 70% of data professionals who struggle with trust in their data, and 53% prioritize it as the key to improving data integrity. (source)
49. Leading marketers are 72% more likely than the mainstream to invest in improving the quality and volume of first-party data. (source)
50. In “data-leading” organizations, 70% more respondents reported easy access to needed data compared to “data-aware” organizations. (source)
Data-Driven Decision-Making Statistics by Region
51. Singaporean business leaders face data overload, leading to decision paralysis (63%), mistrust (87%), and fatigue (76% preferring robot decision-making). (source)
52. In 2020, 77% of US organizations made data-driven decisions, leading the world in data-informed decision-making. (source)
53. Spending on big data and analytics in Asia Pacific (Apac) was predicted to reach US$42.2 billion ($57 billion). (source)
54. Italian business managers say data-driven decisions bring faster decision-making, improved operations, and new products and services. Only 14% see data monetization as a benefit. (source)
Future of Data-Driven Decision Making: Predictions and Statistics
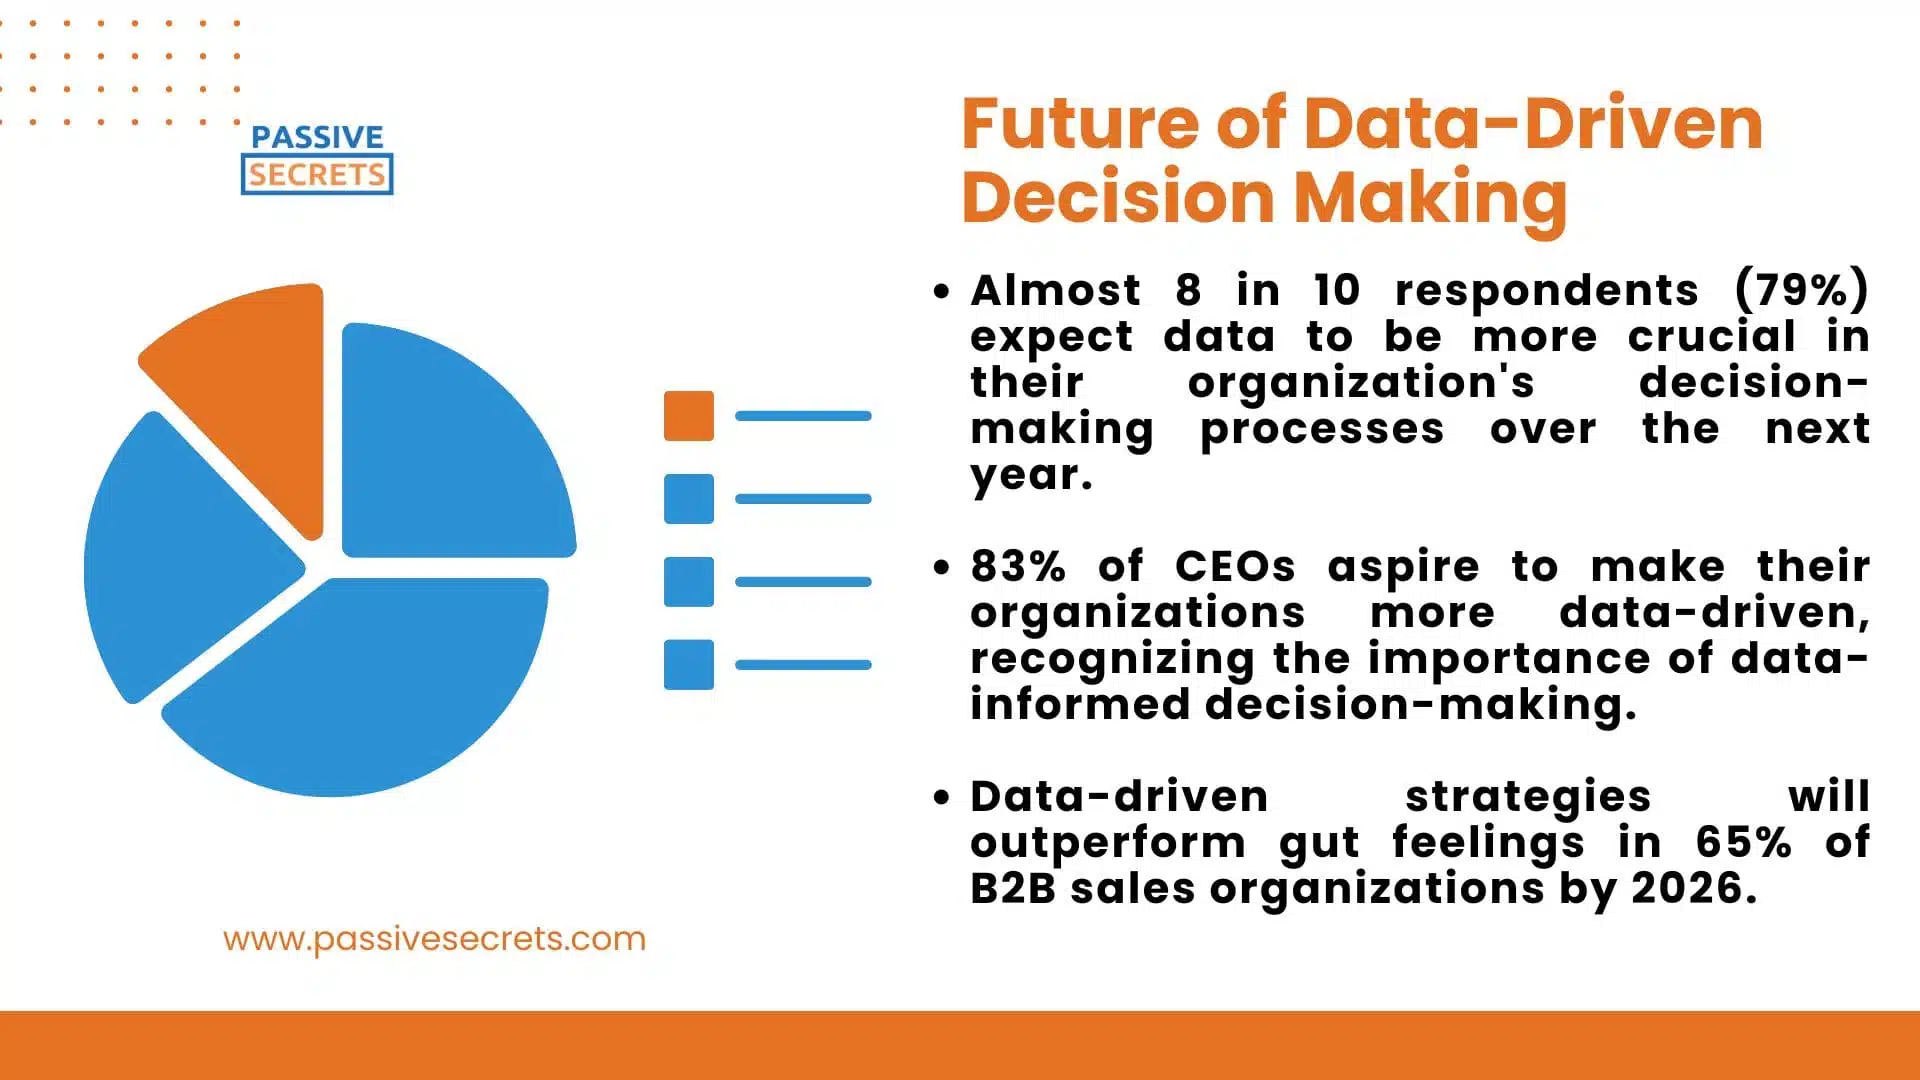
55. Almost 8 in 10 respondents (79%) expect data to be more crucial in their organization’s decision-making processes over the next year. (source)
56. 83% of CEOs aspire to make their organizations more data-driven, recognizing the importance of data-informed decision-making. (source)
57. Data-driven strategies will outperform gut feelings in 65% of B2B sales organizations by 2026. (source)
Data-Driven Decision-Making Trends
Trend 1. Artificial intelligence (AI)
Previously, decision-making relied on human intuition, frequently resulting in subjective targeting, erroneous cost estimates, and dangerous business initiatives. AI addresses these restrictions by offering objective analysis and real-time insights, directing initiatives to success. It excels at recognizing important patterns in data and developing self-evolving models that reliably forecast project results.
This real-time insight enables organizations to make data-driven decisions that outperform traditional approaches. Furthermore, AI’s continual learning, fueled by massive data streams, propels enterprises toward more efficient operations and informed plans.
Trend 2: Advanced Analytics Arsenal
Advanced analytics approaches use historical and real-time data to identify hidden hazards, predict market shifts, and improve project success rates with unparalleled accuracy.
These techniques optimize operations and contribute to excellent client experiences, giving firms a strategic advantage.
It’s about gaining insights and making proactive decisions for a competitive advantage.
Trend 3: Hyper-Personalization
One-size-fits-all has given way to hyper-personalization.
Businesses use client data to create tailored experiences, suggestions, and services. Companies can generate hyper-personalized solutions by analyzing browsing history, interests, and demographics.
This level of detail builds client relationships and allows data-driven decisions that meet specific needs and exceed expectations.
Trend 4: Cloud-Powered Agility
The transition to cloud-based data storage and processing is quickening.
Cloud platforms offer superior scalability, flexibility, and cost-effectiveness compared to traditional on-premises solutions.
They also provide enterprises with advanced analytics and machine learning tools, allowing them to realize the full value of their data.
This leads to seamless collaboration, real-time insights, and the ability to process enormous datasets quickly. As data volume and complexity increase, cloud-based solutions provide the agility and processing capacity to make informed, data-driven decisions.
Conclusion
These data-driven decision-making statistics prove that embracing a data-driven approach is no longer a nicety but necessary for businesses and organizations seeking to thrive in today’s data-rich landscape.
With the power of data, you can transform decision-making, drive growth, and stay ahead of the competition.
While challenges remain, the benefits of data-driven decision-making far outweigh the costs. So, don’t just rely on gut feelings or assumptions – let the numbers guide you towards a brighter future. Embrace the data revolution and watch your organization flourish!
Frequently Asked Questions
What percentage of decisions are data-driven?
50% of all business decisions are based on data, but only half of the available data in organizations is used for decision-making.
How effective is data-driven decision-making?
Data-driven decision-making works well because it allows companies to produce predictions and insights in real-time to maximize performance. This enables them to evaluate the efficacy of various tactics and make well-informed business decisions for long-term, steady growth.
Related Posts
- Incredible Women in Leadership Statistics: Insights into Global Gender Representation
- Billionaire Statistics: Surprising Insights About The World’s Wealthiest
- 89 Business Loan Statistics Every Entrepreneur Should Know
- 70+ AI in Education Statistics That Prove the Future Is Already Here
- Soft Skills Statistics: Key Data on Demand, Training, and Impact
- 95+ Fascinating Gift Industry Statistics to Surprise and Delight
- Top Business Coaching Statistics & Trends Every Leader Should Know
- How Much Are People Saving? Key Personal Savings Statistics Explained
- 40+ Useful Procrastination Statistics To Help You
- 90 Amazing Millionaire Statistics & Facts You Dare Not Miss
- 50+ Latest Life Coaching Statistics And Huge Trends
- 30+ Useful Real Estate Photography Statistics and Trends You Need to Know
- 54 Incredible Goal-Setting Statistics To Help You
- 45+ Interesting Communication Skills Statistics & Huge Trends
- Body Language Statistics & Fun Facts To Boost Your Communication Skills
- 35 Interesting Public Speaking Fear Statistics & Fun Facts
- 25+ Most Interesting Emotional Intelligence Statistics & Fun Facts

