
Did you know that 40% of job seekers would consider taking a pay cut just to work remotely? Job seekers are looking for better work opportunities for themselves.
Looking for a new job can be tough! I get it. Millions of job seekers navigate the twists and turns of the job market daily.
As the global workforce continues to evolve, understanding the latest job seeker statistics and trends is crucial for job seekers and employers.
Fortunately, I have gathered very important job seeker statistics you need to know about the market.
This article will examine the most up-to-date statistics about job seekers and explore the insights and trends shaping the modern job market.
Whether you’re a job seeker looking for a competitive edge or an employer seeking to attract top talent, this data-driven guide will provide the information you need to succeed in today’s fast-paced job market.
Top Job Seekers Statistics (Editor’s Pick)
- Singapore is experiencing a 96% surge in foreign job seekers, primarily from people in Malaysia (32%), India (16%), and the Philippines (7%).
- The global job search software market was worth $2.4 billion in 2023 and is expected to grow to $4.3 billion by 2030 at 7.1% per year.
- 24% of job seekers admitted using AI to help their job search.
- Most workers (82%) want employers to include salary and benefits in job postings.
- 81% of UK job seekers said they would not apply for a role with unrealistic expectations.
- The most frustrating aspect of the interview process for job seekers is having to go through multiple rounds of interviews (64%).
- Job seekers often reject job offers due to feeling undervalued and unappreciated during the hiring process.
- 40% of American workers are actively looking for a new job.
- In a US survey, 60% of respondents were active job seekers, and the other 40% were passive.
- About 76 million people in the Asia Pacific region want employment but are not actively seeking a job or are unavailable.
- Approximately 503,000 job seekers in France were over 50 years old.
- Older workers (50+) prioritize challenging and meaningful work when looking for a new job, while younger workers (18-34) prioritize career growth and advancement opportunities.
- Job seekers are mainly driven by career growth (52%) and flexible work arrangements or remote work opportunities(49%).
- In 2023, Asia-Pacific had 88.5 million unemployed people, resulting in an unemployment rate of 4.2%.
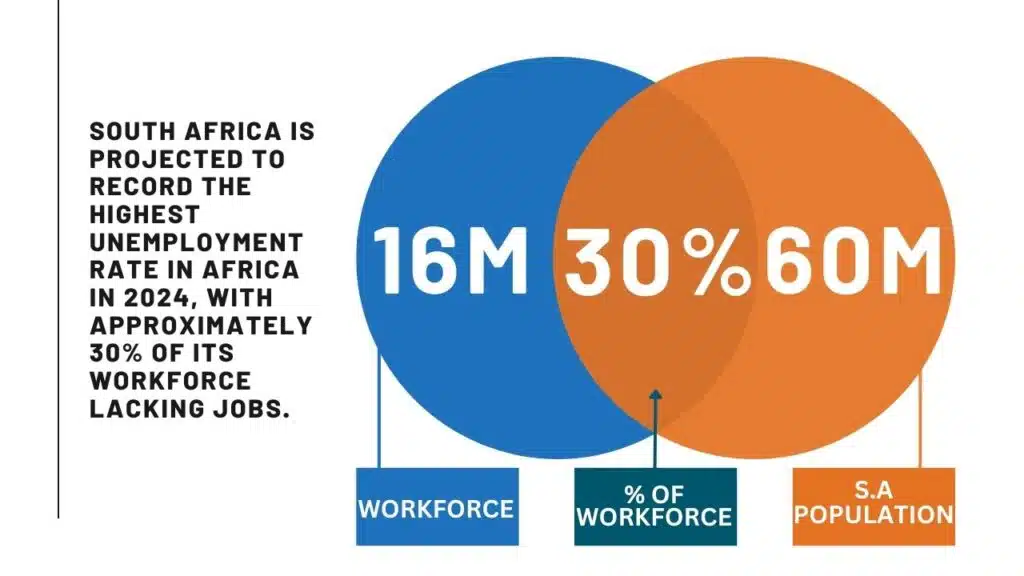
- South Africa is projected to record the highest unemployment rate in Africa in 2024, with approximately 30% of its workforce lacking jobs.
- Employment in Australia is forecasted to increase by 0.2 million people (1.41%) from 2024 to 2025, reaching a peak of 14.43 million people in 2025.
General Job Seekers Statistics
1. Only one-third of job seekers believe job postings adequately display salary information. (source)
2. In Nigeria, over 20% of young people aspire to be traders or business owners by age 30. Doctors and engineers were also popular career choices, but gender and economic background influenced their aspirations. (source)
3. Compared to last year, 38% of workers think finding a job is harder (down from 69% in 2021). Meanwhile, 35% think it will get easier to find a job in 2022 (up from 14% in 2021). (source)
4. In the past year, 30% of job seekers were asked about their salary history, and 86% answered truthfully. (source)
5. 90% of academic job seekers want full-time work, but 30% are also interested in part-time roles. (source)
6. Singapore is experiencing a 96% surge in foreign job seekers, primarily from people in Malaysia (32%), India (16%), and the Philippines (7%). (source)
7. The top sectors in which foreign job seekers in Singapore are mainly interested are administration (11%), technology (7%), management (5%), sales (5%), and manufacturing (5%). (source)
8. The top countries that offer job-seeker visas are Germany, Austria, Sweden, the United Arab Emirates, and Portugal. The United Kingdom just recently joined the list. (source)
Job Search Method Statistics
9. Workers typically search for job openings through online job boards (59%), friends (46%), social media (39%), company websites (33%), professional connections (25%), and career fairs (23%). (source)
Statistics About Job Seekers and Technology
10. Today, about 99% of Fortune 500 companies utilize ATS software to streamline their recruitment processes. However, a study found that ATS software failed to recognize some job seekers’ contact information 25% of the time. (source)
11. Three-quarters (75%) of job applications do not undergo human review. (source)
12. The global job search software market was worth $2.4 billion in 2023 and is expected to grow to $4.3 billion by 2030, at 7.1% per year. (source)
13. 24% of job seekers admitted using AI to help their job search. (source)
14. The majority of job seekers (68%) are using AI to discover and match suitable job openings. Additionally, 58% are using it to craft and refine their resumes. 48% admitted to using AI to write and review cover letters, and 42% used it to generate potential interview questions. Only a quarter (25%) of job seekers use AI to assess their video interview skills. (source)
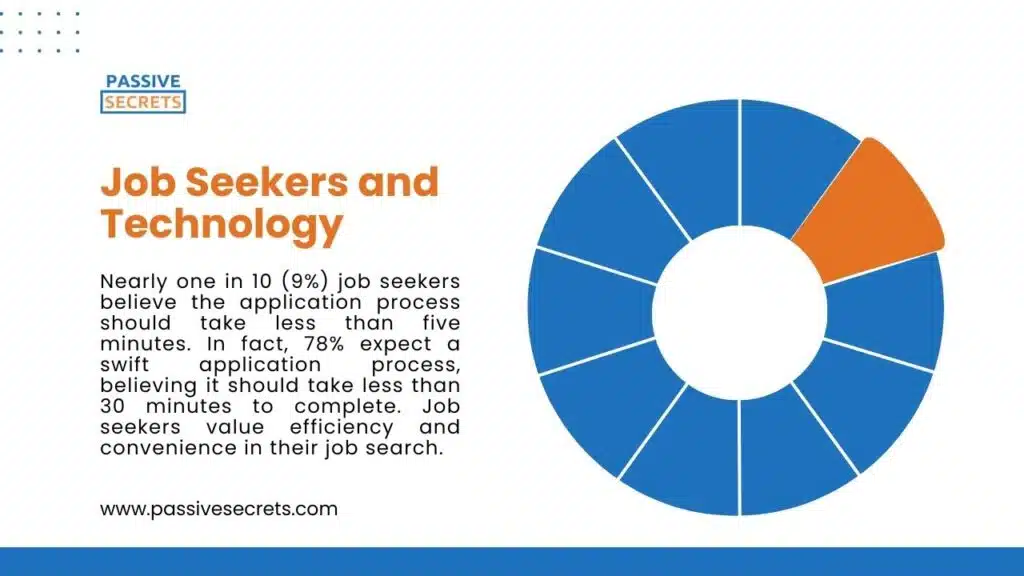
15. Nearly one in 10 (9%) job seekers believe the application process should take less than five minutes. In fact, 78% expect a swift application process, believing it should take less than 30 minutes to complete. Job seekers value efficiency and convenience in their job search. (source)
Job Seekers Preferences Statistics
16. Healthcare workers prioritize benefits like health care and retirement plans when considering a job offer, with 39% ranking them in their top three considerations. This is significantly higher than other industries, particularly tech, where only 13% prioritize benefits. (source)
17. 42% of workers have received a text from a recruiter to schedule an interview. Of those, 56% prefer texting over email or phone calls for scheduling interviews. (source)
18. 37% of job seekers have had video interviews with recruiters. Of those, 59% prefer video interviews over in-person or phone calls. (source)
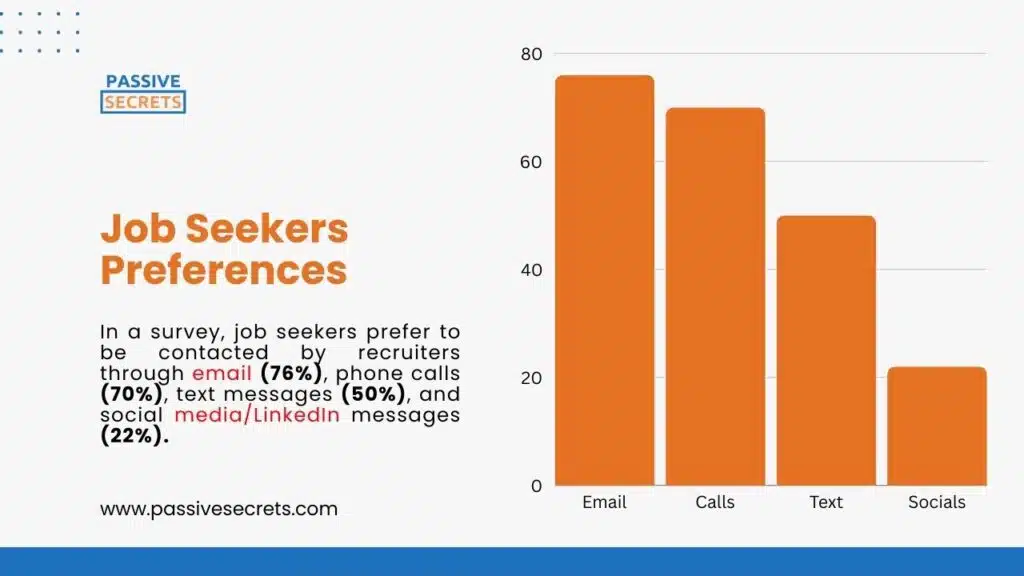
19. In a survey, job seekers prefer to be contacted by recruiters through email (76%), phone calls (70%), text messages (50%), and social media/LinkedIn messages (22%). (source)
20. 74% of workers prefer permanent employment over contract work. (source)
21. Most workers (82%) want employers to include salary and benefits in job postings. This transparency would give them more confidence (74%) to negotiate salaries. (source)
22. 40% of job seekers would consider taking a pay cut just to work remotely. (source)
23. 81% of UK job seekers said they would not apply for a role with unrealistic expectations. (source)
24. UK job seekers prioritize clear communication. 78% of younger job seekers said they would ignore a job listing if it didn’t include salary expectations. Also, 74% of workers over 55 consider this a major issue. (source)
25. In the UK, workers aged 18-34 prioritize company culture, with 86% considering it important, compared to 66% of workers over 55. Additionally, 81% of younger workers ask about culture in interviews versus 57% of older workers. (source)
26. After an interview, the top turn-offs for job seekers that would make workers less likely to accept a job offer from a company are poor communication (64%), overly positive company pitch (57%), and not meeting future colleagues (51%). (source)
27. 53% of job seekers say they’d be less likely or never apply for a role that doesn’t mention company culture in the job description. (source)
28. 64% of UK workers want clear hybrid working guidelines, including rules on availability, when considering a new job. Other top priorities were available home office equipment (63%) and career development opportunities (60%). (source)
29. About 1 in 4 job seekers (23%) would turn down a job if they had to work entirely in an office, showing a consistent preference for remote work options over the past year. (source)
30. 80% of UK job seekers prefer hybrid working as their top working pattern. (source)
Common Challenges for Job Seekers
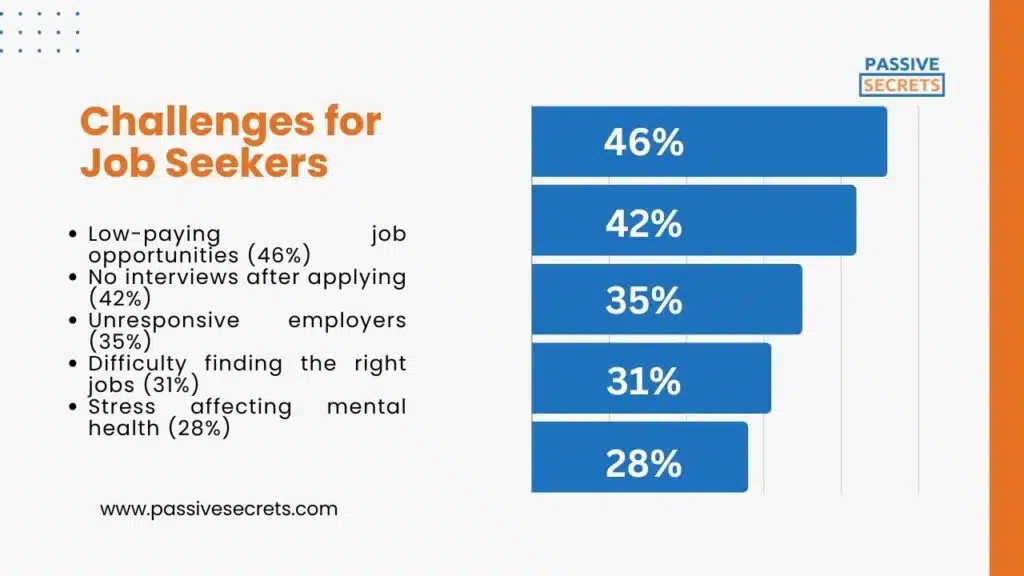
31. Job seekers find the following aspects of the job search most frustrating:
- Low-paying job opportunities (46%)
- No interviews after applying (42%)
- Unresponsive employers (35%)
- Difficulty finding the right jobs (31%)
- Stress affecting mental health (28%)
These are followed by concerns about algorithmic judgment, misleading job descriptions, limited job openings in their field, and the hassle of updating job materials. (source)
32. For 49% of job seekers, the most frustrating aspects of the job search process include encountering poor search results with too many irrelevant jobs. Other annoying aspects are difficulty finding jobs that match their skills and expertise (48%), receiving SPAM emails (43%), struggling to find jobs in their field (41%), and the lengthy time required to search for jobs (34%). (source)
33. When applying for jobs, the most frustrating aspects include having to input the same information from their resume into the application multiple times (65%), the lengthy time required for each application (56%), not hearing back from the employer at all (52%), being forced to register to apply (46%), receiving generic automated confirmation emails (42%), and having to join the talent network to apply (39%). (source)
34. During the interview process, the most frustrating aspects include having to go through multiple rounds of interviews (64%), not hearing back from the employer after interviews are complete (50%), and not receiving feedback from the employer (47%). (source)
35. Finally, when it comes to the offer process, the most frustrating aspects include the length of time it takes to receive an offer (63%), a lack of transparency in the offer process (62%), and the offer process taking too long from the employer’s side (50%). (source)
36. Job seekers often reject job offers due to feeling undervalued and unappreciated during the hiring process, followed by concerns about pay and job suitability. (source)
Active Vs. Passive Job Seekers Statistics
37. 45% of workers are seeking a new job or plan to do so within a year. Of those, 54% haven’t explored internal opportunities at their current company, looking elsewhere for a new role. (source)
38. Most workers (62%) are happy with their current jobs, but a significant portion (43%) are still open to exploring other opportunities. This indicates that workers have a strong desire for potential growth or change. (source)
39. Although 79% of American workers are content with their current jobs, 86% are receptive to new opportunities, with 46% actively seeking a change. (source)
40. 40% of American workers are actively looking for a new job. (source)
41. Among the 52% of workers who are not actively job hunting, 54% would consider a new role if a recruiter approached them. Their main reasons for switching are flexible work arrangements or remote work (43%) and career advancement (42%). (source)
42. In a US survey, 60% of respondents were active job seekers. The other 40% were passive. (source)
43. 84% of academic job seekers in the UK are actively searching and applying for job opportunities. (source)
44. 49% of UK academic job seekers actively search and apply for academic/academic research job opportunities. (source)
45. A UK survey of academic job seekers revealed that 13% of respondents actively seek paid research opportunities. (source)
46. 34% of respondents are actively job hunting for professional, managerial, or support roles. (source)
47. Additionally, 76 million people in the Asia Pacific region want employment but are not actively seeking a job or are unavailable. (source)
Job Seekers Demographics Statistics
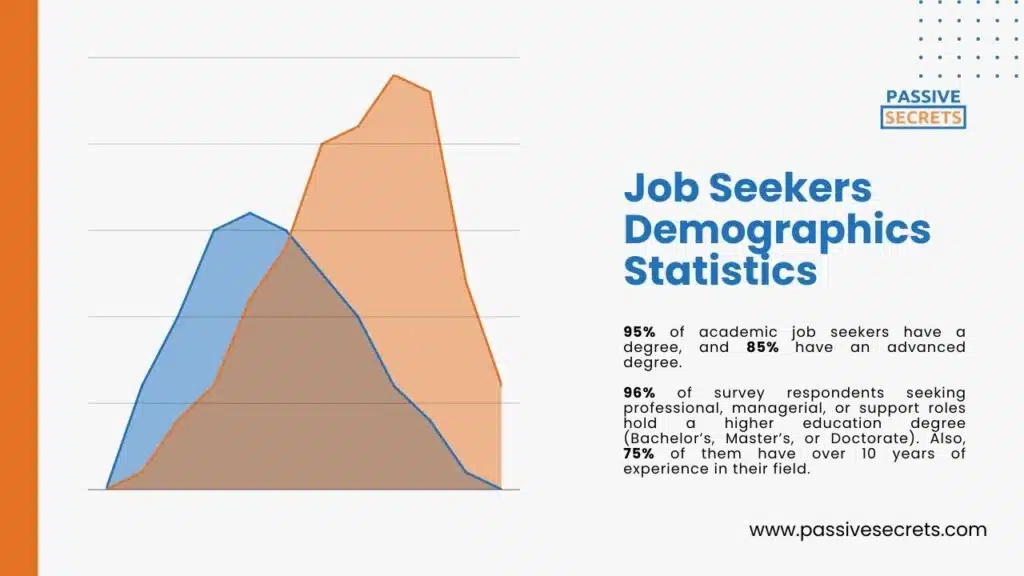
48. 95% of academic job seekers have a degree, and 85% have an advanced degree. (source)
49. 96% of survey respondents seeking professional, managerial, or support roles hold a higher education degree (Bachelor’s, Master’s, or Doctorate). Also, 75% of them have over 10 years of experience in their field. (source)
50. As of the first quarter of 2023, approximately 503,000 job seekers in France were over 50 years old. (source)
Job Seekers Motivation Statistics
51. Older workers (50+) prioritize challenging and meaningful work when looking for a new job, while younger workers (18-34) prioritize career growth and advancement opportunities. (source)
52. According to a survey, 93.7% of entry-level job applicants search for salary information before applying, a figure that decreases for director-level positions. (source)
53. Almost half (49%) of workers think they could increase their earnings by switching to a new job. They believe that better pay opportunities exist elsewhere. (source)
54. Job seekers are mainly driven by career growth (52%) and flexible work arrangements or remote work opportunities(49%). Many (50%) find job hunting easy, and most (56%) think the market favours them. They’re also optimistic about finding a new job quickly, with 61% expecting it to take no more than three months. (source)
55. Workers are mainly motivated to job hunt due to burnout in their current role (53%) and economic stress (47%). (source)
56. Concerns about layoffs (40%) and employer’s financial future (38%) increasingly drive job search decisions. (source)
Employment and Unemployment Rate By Country
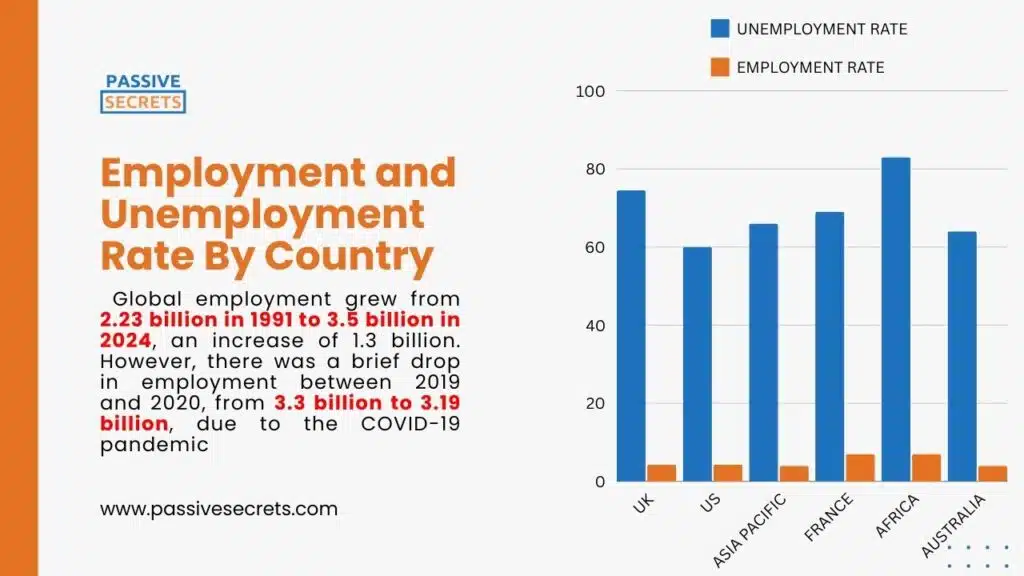
57. Global employment grew from 2.23 billion in 1991 to 3.5 billion in 2024, an increase of 1.3 billion. However, there was a brief drop in employment between 2019 and 2020, from 3.3 billion to 3.19 billion, due to the COVID-19 pandemic. (source)
UK
58. The UK’s Office for Budget Responsibility predicts unemployment will rise to 4.5% by the end of 2024, revising its previous forecast. On the other hand, the Bank of England also expects unemployment to increase, reaching 4.6% in mid-2025 and 4.8% in mid-2026. Then, the independent forecasts surveyed by the Treasury estimate an average unemployment rate of 4.3% for both the end of 2024 and 2025. (source)
59. From January to March 2024, 33.0 million people aged 16 and over were employed in the UK. With an employment rate of 74.5% for those aged 16-64. (source)
60. Employment levels decreased in the UK by approximately 204,000 over the past year, leading to a decline in the employment rate. (source)
61. The unemployment rate in the UK stood at 4.3%, with 1.49 million individuals aged 16+ unemployed. This marks an increase of 103,000 in unemployment over the previous year. (source)
62. In the three months up to May 2024, there were around 904,000 job openings in the UK, compared to 908,000 reported in the previous month. (source)
63. Job vacancies in the UK peaked at 1.3 million in the three months leading to May 2022, declining steadily until March 2024. (source)
United States
64. In the United States, job seekers rose to 5.678 million in the latest update. Up from 5.206 million last month and 5.197 million a year ago, marking increases of 9.07% and 9.26% respectively. (source)
Asia-Pacific
65. In 2020, India saw an increase in unemployment to 7.7% for both men and women, up from 5.3% and 5.2% respectively in 2019. (source)
66. Nepal experienced a significant rise in unemployment in 2020, reaching 4.4% from 3.0% for men and 2.7% for women in the previous year. (source)
67. Nepal’s unemployment rate was approximately 11.12% in 2022, while Cambodia’s was about 0.36% of the total labour force. (source)
68. In 2023, Asia-Pacific had 88.5 million unemployed people, resulting in an unemployment rate of 4.2%. (source)
69. Unemployment rates in the Asia-Pacific region are generally lower among women compared to men. (source)
70. Youth unemployment in the Asia-Pacific rose significantly to 13.9% in 2023, affecting 35.8 million young individuals seeking employment. (source)
France
71. In 2022, France had an unemployment rate of approximately 7.45%. (source)
72. During the first quarter of 2022, around 2.23 million individuals actively sought employment in France. Men constituted the majority of job seekers. (source)
73. In April 2024, the number of unemployed individuals in mainland France decreased by 36.4 thousand from the previous month to 2.775 million. (source)
74. Regarding gender, female unemployment decreased by 5.2 thousand to 1.379 million, while male unemployment dropped by 10.6 thousand to 1.432 million. (source)
Africa
75. South Africa is projected to record the highest unemployment rate in Africa in 2024, with approximately 30% of its workforce lacking jobs. Djibouti and Eswatini are closely following, with 28% and 25% unemployment rates, respectively. (source)
76. Niger and Burundi have the lowest unemployment rates in Africa. (source)
77. The youth unemployment rate in Africa for 2024 is expected to be around 11%, with certain countries facing severe challenges. (source)
78. In 2022, Djibouti reported an alarming youth unemployment rate of nearly 80%, the highest on the continent. South Africa followed with about 52% of its young workforce unemployed. (source)
79. Female unemployment in Africa stood at approximately 8% in 2023, compared to 6.6% among men. (source)
Australia
80. Employment in Australia is forecasted to increase by 0.2 million people (1.41%) from 2024 to 2025, reaching a peak of 14.43 million people in 2025. (source)
81. In May 2024, Australia’s unemployment rate rose to 4.0%, with the number of unemployed individuals increasing by 2,800 to 590,600. Meanwhile, the youth unemployment rate stayed at 9.7%. (source)
82. During May 2024, full-time employment rose by 26,200 to 9,892,000 people, and part-time employment increased by 12,500 to 4,463,100 people. Part-time employment accounted for 31.1% of total employment. (source)
83. The employment-to-population ratio remained unchanged at 64.1% in May 2024. (source)
84. Australia’s unemployment rate is projected to rise by a total of 0.4 percentage points between 2024 and 2029, with a forecasted rate of 4.59% in 2029. (source)
Conclusion
Job seeking can be complex but is ever-evolving. As these statistics show, job seekers are a diverse group with unique needs, preferences, and challenges. By understanding these job seekers’ statistics, employers, policymakers, and job seekers can work together to build a more inclusive, supportive, and effective job market.
As the job market continues to shift and adapt to new technologies, economic conditions, and societal changes, one thing is clear: the future of work belongs to those prepared to adapt, learn, and innovate.
Whether you’re a job seeker, employer, or someone interested in the world of work, I hope these statistics have provided valuable insights and inspiration.
Frequently Asked Questions
How many people in the world are looking for jobs?
The exact number of people looking for jobs isn’t quite known. However, a report shows that the global unemployment rate improved slightly to 5.1% in 2023, down from 5.3% in 2022. The number of people wanting jobs decreased to 435 million in 2023, from 500 million in 2020 and 440 million in 2022.
How many job seekers are there in the UK?
Research shows that half of UK workers are actively looking for a new role or are planning to seek new job opportunities in the next six months.
What are the three types of job seekers?
The three types of job seekers are u003cstrongu003eactive job seekersu003c/strongu003e (actively searching for new job opportunities because they are unemployed or dissatisfied with their current role), u003cstrongu003eexploratory job seekersu003c/strongu003e (not actively looking for a new job but are open to new opportunities and willing to consider a change if the right circumstances), and u003cstrongu003epassive job seekersu003c/strongu003e ( currently employed and relatively satisfied but would be open to considering a new role).
How many job seekers are there in the US?
The number of job seekers in the United States rose to 5.678 million in the latest update. Up from 5.206 million last month and 5.197 million a year ago.

Related Posts
- 80+ Employee Benefit Statistics: Insights and Trends
- The Most Important Wealth Management Statistics You Can’t Afford to Ignore
- Enterprise Data Management: Essential Statistics and Emerging Trends
- 93 Talent Management Statistics to Help You
- Top Reputation Management Statistics and Trends to Improve Your Brand
- 36 Helpful Social Worker Burnout Statistics To Know
- 100 Business Process Outsourcing Statistics & Facts
- Top HR Outsourcing Statistics and Trends Every Business Must Know
- The Top Outsourcing Statistics You Shouldn’t Ignore
- 47+ Shocking 4-day Work Week Statistics To Know
- 105+ Supply Chain Statistics & Facts You Can’t Ignore
- 50+ Interesting Employer Branding Statistics And Trends
- 95 Interesting Job Interview Statistics and Huge Trends To Know
- 60+ Helpful Change Management Statistics & Facts
- 65+ Employee Performance Management Statistics & Trends
- Workforce Management Statistics: Trends, Insights, & Opportunities
- 73 Revealing Workplace Distraction Statistics
- Workplace Romance Statistics: How Common Is Workplace Romance?
- 40+ Top Workplace Conflict Statistics You Should Know
- The State of Workplace Communication: Key Statistics and Trends
- 55 Workplace Collaboration & Teamwork Statistics

