As the modern workplace continues to evolve, employee benefits have become a crucial factor in attracting, retaining, and motivating top talent.
But what benefits do employees truly value?
How are organizations adapting to meet their changing needs?
From flexible work arrangements to mental health support, the world of employee benefits is shifting rapidly.
In this insights-driven exploration, we highlighted the latest employee benefit statistics and trends.
These statistics reveal the most effective strategies for creating a benefits package that drives business success and supports the well-being of your most valuable asset – your people.
Key Employee Benefit Statistics & Trends (Editor’s Pick)
- Employers consider healthcare benefits most crucial (88%), followed closely by leave benefits, retirement savings, and planning benefits (81%).
- 96% of companies prioritize health and risk benefits, while less focus on pension benefits (74%) and leave benefits (72%).
- 1 in 10 workers would take a pay cut for better benefits.
- 70% of employers offer fully insured health plans, while 27% have self-insured plans.
- 95% of employers believe whole-person care improves the healthcare experience and benefits package.
- 42% of employers in Asia plan to enhance their health and well-being benefits.
- Employers provide health benefits to 153 million Americans.
- Employers are slightly more likely to offer non-retirement financial advice (32%) and credit counselling (16%), but fewer offer credit union services (11%).
- 87% of organizations pay superannuation contributions during parental leave.
- 28% of Australian employers offer a 4-day workweek with compressed hours, but only 3% offer it with no pay cut.
- Employers spent significantly more on benefits for union workers ($22.63/hour) compared to non-union workers ($12.14/hour).
- Only 56% of employers offer student loan repayment benefits.
- Cost is the top challenge in employee benefits.
Overview of Employee Benefits: Key Global Statistics
1. Employers consider healthcare benefits most crucial (88%), followed closely by leave benefits, retirement savings, and planning benefits (all 81%). Flexible work arrangements, family care, and professional development benefits are also highly valued, with 70%, 67%, and 65% importance ratings, respectively. (source)
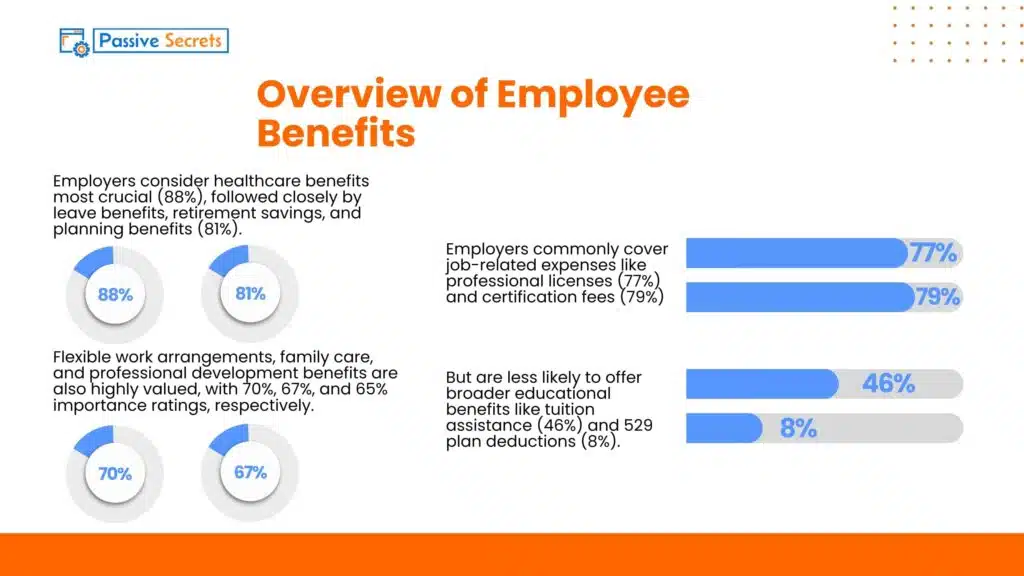
2. Employers commonly cover job-related expenses like professional licenses (77%) and certification fees (79%) but are less likely to offer broader educational benefits like tuition assistance (46%) and 529 plan deductions (8%). (source)
3. 73% of employees would be more likely to stay with their company if they had better health insurance options, and one-third would even give up a pay raise for more benefits. (source)
4. Employees with more benefits are more likely to thrive, with 82% of those with 10+ benefits and 58% of those with 1-4 benefits reporting they are thriving. (source)
5. 70% of employees want customizable benefits, a 3% increase from pre-pandemic levels. Also, 80% of employees want their benefits provider to innovate with digital technology, and 82% want to manage their benefits online. (source)
6. Nearly 8 in 10 employees (78%) believe their employer is responsible for helping them become “net better off,” up 11% from pre-pandemic. (source)
7. In 2025, most employers (89%) plan to enhance their benefits by either enriching current ones or adding new ones, while 30% intend to keep their benefits unchanged. (source)
8. 96% of companies prioritize health and risk benefits, while less focus on pension benefits (74%) and leave benefits (72%). (source)
9. In Asia, employees prioritize benefits that boost satisfaction and retention (53%), followed by budget considerations (35%) and employee wellbeing (33%). (source)
10. In Asia, HR practitioners (62%) prioritize increasing employee satisfaction and retention more than business owners (35%), although it’s a top-three concern for both groups. (source)
11. Full-time workers had greater access to benefits than part-time workers: 89% vs 26% for medical care and 99% vs 43% for retirement benefits among state and local government workers. Take-up rates were also higher for full-time workers. (source)
12. 40% of employers believe workers leave for jobs with better benefits, while 54% of American workers report being satisfied with their current benefits. (source)
13. 1 in 10 workers would take a pay cut for better benefits. (source)
14. Work-life balance is the top company culture priority for 51% of employees and 47% of employers. Trust is also important, with 20% of employees and 27% of employers valuing being trusted or building trust with employees. (source)
15. US employees are most likely to quit their job for higher pay, while flexible work-from-home options are the least important issue, cited by only 20% of respondents. (source)
16. 87% of HR professionals believe their employer’s offerings are competitive. They rated their organization’s offerings an average of 7.4/10, with 53% giving a rating of 8 or higher. (source)
17. Most HR professionals believe benefits packages impact recruiting and retention. In fact, 97% report some level of impact, with 44% saying benefits have a big impact and only 4% saying little to no impact. (source)
18. Most employees (88%) receive benefits education through 1-on-1 HR support, and 85% rely on HR for ongoing benefits-related questions and support. (source)
19. More than half (54%) of organizations in Australia describe their internal culture as promoting a healthy “work-life balance”. (source)
Employee Benefit Statistics by Type
Health and Wellness Benefits
20. 70% of employers offer fully insured health plans, while 27% have self-insured plans, where they cover medical claims themselves. (source)
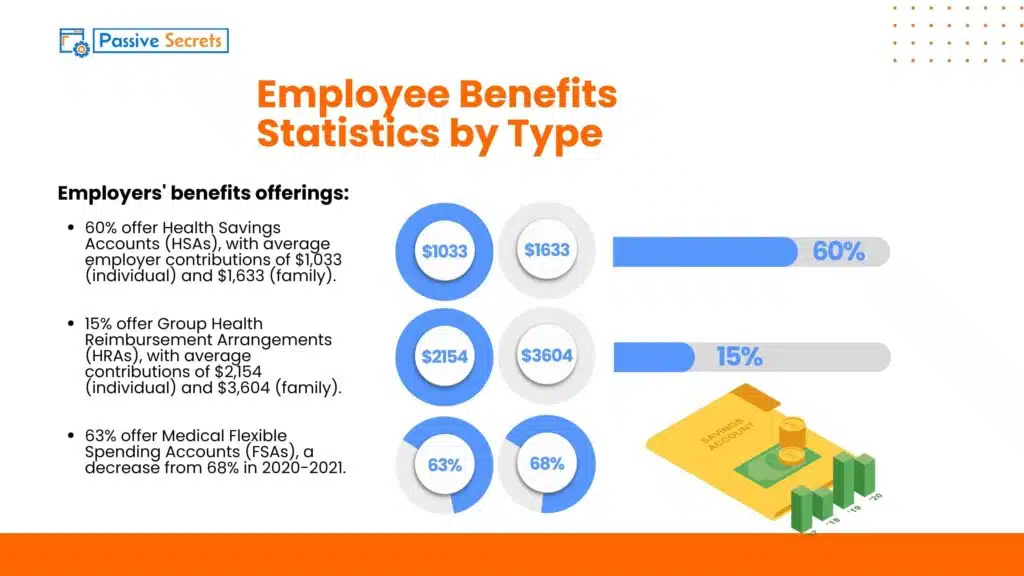
21. Employers’ benefits offerings:
22. Employers’ coverage of specific health benefits is varied: 12% cover gender-affirming hormone therapy and 11% cover gender-affirming surgery. Menopause-related benefits are offered by 17% of employers, but only 2% provide menstrual and/or menopause leave beyond standard sick time. (source)
23. Investing in mental health can bring significant returns, with $1 invested potentially saving $2-$4 in healthcare costs. Additionally, 61% of employees report that their mental health affects productivity at work. In fact, depression and anxiety have a staggering economic impact, costing the global economy an estimated $1 trillion annually in reduced productivity. (source)
24. 95% of employers believe whole-person care improves the healthcare experience and benefits package. They’re taking action, as 95% address health equity. However, health inequities currently cause a $42 billion annual productivity loss in the US, projected to reach $1 trillion by 2040 if unaddressed. (source)
25. Health benefit costs rose 5.2% per employee in 2023. One-quarter of employers predict costs would jump 10%+ without plan changes. To mitigate this, 84% of employers prioritize managing high-cost claimants as their top strategy for the next 3-5 years. (source)
26. In 2023, the average annual health insurance premium costs were $23,968 for family coverage and $8,435 for self-only plans. Employers covered, on average, 83% of self-only plans and 73% of family plans. (source)
27. 85% of companies in Asia offer insurance benefits, with life/accident insurance being the most common (55%). However, critical illness insurance (25%) and dependent health insurance (17%) are significant gaps in current offerings. (source)
28. 42% of employers in Asia plan to enhance their health and well-being benefits, while 19% intend to review or improve flexible/voluntary benefits within the next two years. (source)
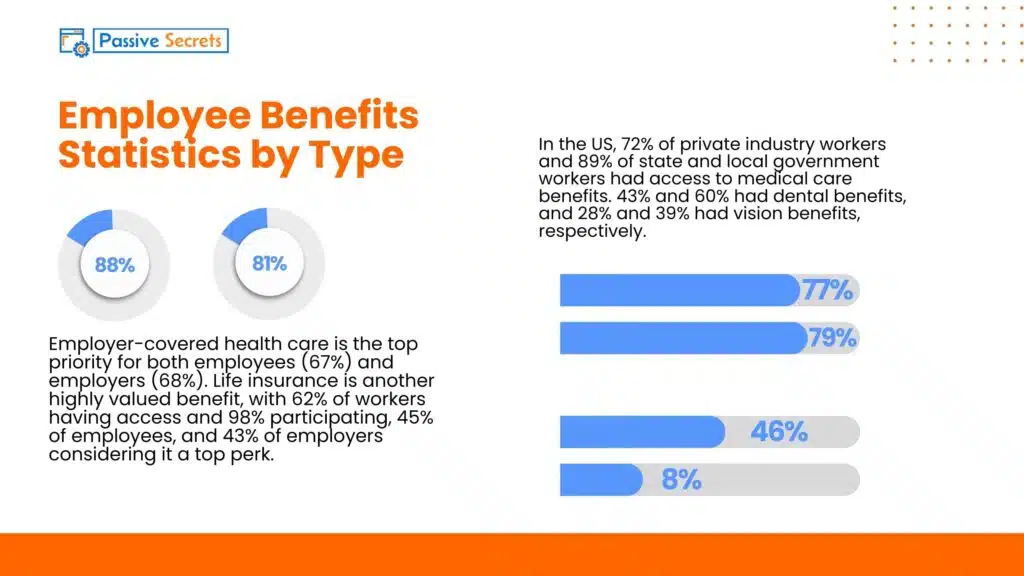
29. In the US, 72% of private industry workers and 89% of state and local government workers had access to medical care benefits. 43% and 60% had dental benefits, and 28% and 39% had vision benefits, respectively. (source)
30. Among US private industry workers, access to medical care benefits varied by industry: 85% in goods-producing, 70% in service-providing, and 75% in education and health services. State and local government workers in service-providing industries had higher access (89%) and take-up rates (75%). (source)
31. In the 2024 plan year, 84% of employers offered a combination of traditional health plans and high-deductible health plans (HDHPs), providing employees with more options. (source)
32. Both employers (68%) and employees (67%) prioritize employer-covered health care as the most important benefit, especially employees over 42 (80+%). (source)
33. Employers (33%) prioritize mental health assistance more than employees (23%), showing a gap between employer perceptions and employee needs. (source)
34. Employer-covered health care is the top priority for both employees (67%) and employers (68%). Life insurance is another highly valued benefit, with 62% of workers having access and 98% participating, 45% of employees, and 43% of employers considering it a top perk. (source)
34. 95% of employers believe that whole-person care approaches (addressing physical, mental, and emotional well-being) are important. (source)
35. In 2023, 76% of companies covered GLP-1 diabetes meds, while 27% covered them for weight loss, according to the International Foundation of Employee Benefit Plans. (source)
36. Employers provide health benefits to 153 million Americans, effectively making them a major player in the health insurance industry. (source)
37. Although most companies operate in 2-3 states, over 90% offer only 1-3 health insurance plans, limiting employee choices despite varying regional needs. (source)
38. Companies contribute an average of 71-90% towards employee premiums, but contributions vary by company size. Larger companies tend to contribute more. Additionally, companies contribute 8% less towards dependent premiums compared to employee premiums. (source)
39. 81% of employers think employees are satisfied with their medical benefits, but 87% acknowledge employees want more options. In reality, 80% of employees prefer choosing their own plan from all available options, rather than the limited options provided by their employer. (source)
40. 85% of companies have changed healthcare carriers or plan design in the past 5 years, with frequency increasing with company size: 55% (150-500 employees), 67% (1,001-2,000 employees), and 77% (2,001-2,500 employees) made changes two or more times. (source)
41. 1 in 8 working Australians care for children or elderly parents, impacting women (45-65) the most. Despite this, most organizations lack support:
Retirement and Financial Benefits
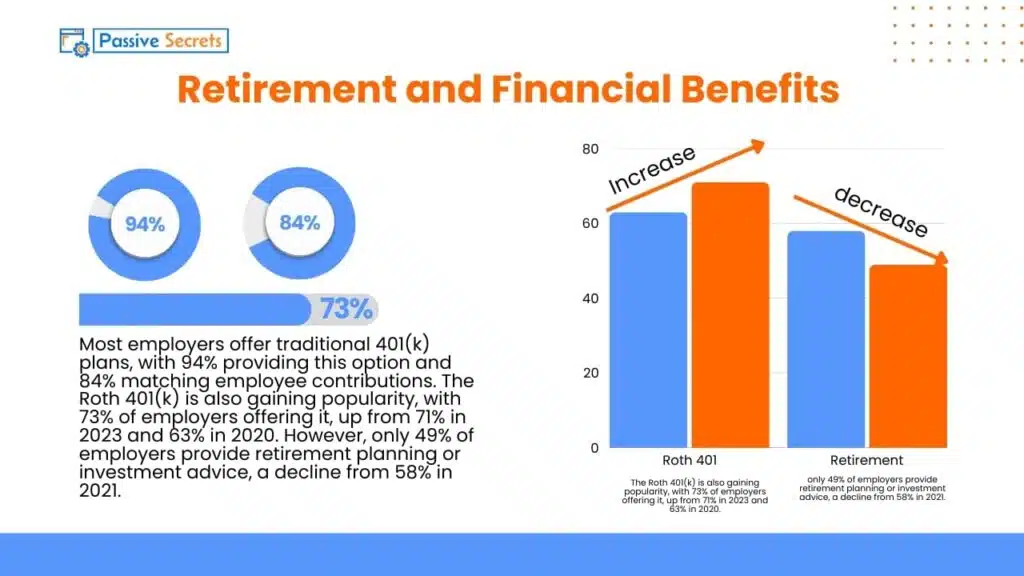
42. Most employers offer traditional 401(k) plans, with 94% providing this option and 84% matching employee contributions. The Roth 401(k) is also gaining popularity, with 73% of employers offering it, up from 71% in 2023 and 63% in 2020. However, only 49% of employers provide retirement planning or investment advice, a decline from 58% in 2021. (source)
43. Employers are slightly more likely to offer non-retirement financial advice (32%) and credit counselling (16%), but fewer offer credit union services (11%). (source)
44. 37% of employers offer student loan repayment assistance, and half of those employers also make matching 401(k) contributions. (source)
45. In 2024, US civilian union workers had better access to federal benefits than non-union workers in every category, with nearly all union members having access to retirement, medical care, and paid leave benefits. (source)
46. US private industry union workers had better access to federal benefits than non-union workers, with nearly all having access to retirement and medical care benefits, compared to 68% of non-union workers. (source)
47. The number of retired workers receiving Social Security benefits rose from 34.59 million in 2010 to 50.15 million in 2023, with a steady year-on-year increase expected to continue. (source)
48. As of December 2023, there were 18.93 million retired worker Social Security beneficiaries aged 62-69, and 33.11 million aged 70-84. (source)
49. US workers primarily expect retirement income from 401(k), 403(b), or IRAs, while inheritance and home equity are the least expected sources. (source)
50. Only 12% of US workers interviewed were very confident that the Social Security system would continue to provide benefits to retirees of at least equal value as those received so far. (source)
Paid Time Off (PTO) and Leave
51. Paid parental leave policies remained steady in 2024, with 40% of employers offering paid parental leave, 32% offering paid paternity leave, and 33% offering paid adoption leave. Paid maternity leave is offered by 39% of employers. (source)
52. Most employers offer paid sick leave and vacation, but fewer provide additional paid leave benefits, with 40% offering paid parental leave. (source)
53. While 91% of employers offer paid bereavement leave, only 39% extend this benefit to cover loss of pregnancy, failed surrogacy, or failed adoption. (source)
54. US Private industry workers had access to paid sick leave (79%), paid holidays (81%), and paid personal leave (49%), while state and local government workers had access to these benefits at rates of 92%, 68%, and 62%, respectively. (source)
55. 75% of organizations handle leave administration in-house, although larger organizations (500+ employees) are slightly more likely to outsource to a third-party administrator. (source)
56. 87% of organizations pay superannuation contributions during parental leave, but 61% only do so for the paid portion of the leave. (source)
Flexible Work and Remote Benefits
57. A four-day workweek is the most sought-after benefit among employees and a top priority for employers to offer in the next three to five years, although employers are slower to implement it. (source)
58. 32% of US employees aged 58-76 want a four-day work week, the highest percentage among all age groups, while those aged 18-25 have the lowest desire for a shorter work week. (source)
59. US employees aged 26-41 showed the strongest preference for working from home, with 41% of this age group favouring remote work. In contrast, those aged 18-25 had the lowest desire to work from home. (source)
60. 83% of Australian companies now have a formal flexible work policy, up from 69% in 2019, offering options like flexitime, 4-day workweeks, and remote work. From these, 69% of companies offer incidental flexitime, allowing employees to work shorter hours for personal reasons and make up the time later. (source)
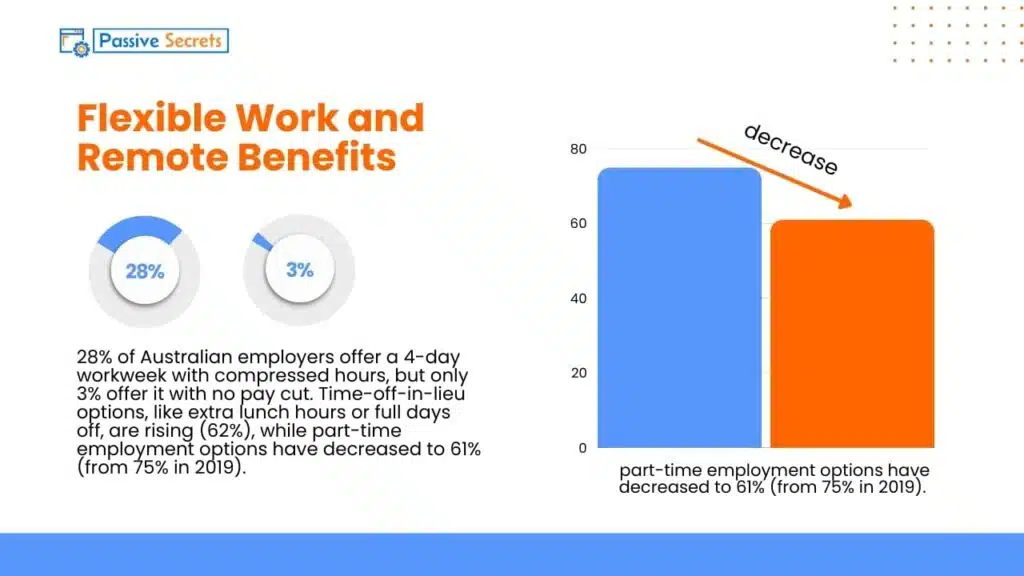
61. 28% of Australian employers offer a 4-day workweek with compressed hours, but only 3% offer it with no pay cut. Time-off-in-lieu options, like extra lunch hours or full days off, are rising (62%), while part-time employment options have decreased to 61% (from 75% in 2019). (source)
62. In Canada, 48% of organizations have location restrictions for employees, while only 10% allow full-time remote employees to work internationally (in select areas). (source)
Professional Development Benefits
63. Most employers offer development benefits, with 82% providing formal training or education for current skills and 80% offering upskilling/reskilling opportunities. (source)
64. Debt assistance is becoming a key priority for employees, with half carrying mortgage or credit card debt and a quarter carrying student loan debt, prompting employers to explore support options. (source)
The Financial Perspective: Benefits Statistics for Employers
65. Benefit cost increases vary by company size, with mid-sized employers seeing a 7.8% increase, small employers a 5.2% increase, and large employers a 4.6% increase. (source)
66. Employers in the US covered 80-86% of medical premiums for single coverage and 68-71% for family coverage, with employees covering the remaining 14-32%. (source)
67. Most benefits-eligible workers (72%) didn’t change their benefits coverage. Additionally, 76% of employed Americans spend 30 minutes or less reviewing their workplace benefits during open enrollment. (source)
68. As of March 2024, state and local government workers had the highest average hourly compensation cost ($61.27), surpassing civilian workers ($45.42). (source)
69. US employers spent around 33% of employee costs on benefits, except for state and local government employers, who spent a higher average of 38.1%. (source)
70. Employers spent more on compensation for unionized private industry workers, averaging $56.65 per hour, compared to non-union workers. (source)
71. Employers spent significantly more on benefits for union workers ($22.63/hour) compared to non-union workers ($12.14/hour). (source)
72. When deciding on benefits, most organizations rely on input from brokers (73%) and direct decisions from company leadership (71%). (source)
73. Companies spend significant time on healthcare administration, with 35-45% dedicating 150-200 hours annually. The overall average time spent across all companies is 210 hours. (source)
Challenges in Employee Benefits: Statistical Analysis
74. Only 56% of employers offer student loan repayment benefits, down from 62% in 2022, with an average annual reimbursement cap of $871. (source)
75. There’s a gap between employer and employee perceptions, with 88% of employers believing they care about employee well-being, but only 66% of employees agreeing. (source)
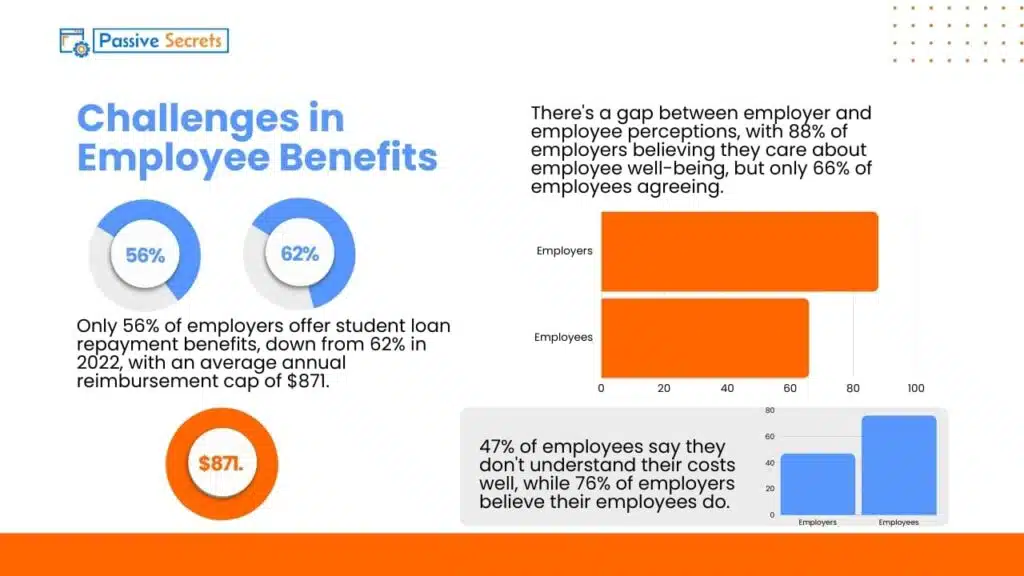
76. 47% of employees say they don’t understand their costs well, while 76% of employers believe their employees do. (source)
77. 85% of companies have a central benefits management structure in place, yet surprisingly, half of these structures are considered relatively immature. (source)
78. Only half of companies have a formalized governance structure. When in place, it typically covers benefit decisions (82%), benchmarking approach (78%), broker/provider use (75%), and design principles (64%). (source)
79. For organizations in Asia that do not offer insurance benefits, budget constraints are the primary obstacle (57%). (source)
80. 70% of benefits-eligible working Americans want their employer’s help to better understand their employee benefits throughout the year, indicating a need for ongoing support and education. (source)
81. Cost is the top challenge in employee benefits. 60% of respondents faced a medical renewal increase of at least 5% this year, highlighting the importance of robust benefits in attracting and retaining top talent. (source) KEY
Employee Benefit Trends
1. Mental health support
Mental health support is a key employee benefit trend in 2025, driven by increasing awareness of its importance and the lasting impacts of stress, anxiety, and burnout.
Employers are addressing these challenges through benefits like therapy access, Employee Assistance Programs (EAPs), mental health coverage in insurance, and dedicated mental health days.
Technological advancements, including teletherapy and wellness apps, make support more accessible, while tailored solutions address diverse workforce needs.
Organizations prioritizing mental health improve employee well-being, productivity, and retention, reflecting its essential role in a sustainable and effective workplace.
2. Work/life Balance
This major employee benefits trend reflects the demand for boundaries between professional and personal life.
Employers will address this through flexible work arrangements, such as remote or hybrid schedules, and reduced reliance on rigid 9-to-5 structures.
Policies supporting work/life balance include shorter workweeks, generous paid leave, and clear guidelines to reduce after-hours communication.
From the statistics, we see that most employees still value four-day work weeks.
These initiatives aim to prevent burnout, improve productivity, and enhance job satisfaction. Companies recognize that supporting employees’ personal priorities is essential for retaining talent and fostering long-term engagement.
3. Personalized Benefits for Employees
Generalized employee benefits are now becoming old-fashioned. Employees are expecting benefits that fit their specific needs and lifestyle.
To improve employee satisfaction and retention, employers will tailor benefits to individual employees’ needs, preferences, and life stages.
By offering personalized benefits, employers can:
Examples of personalized benefits include:
4. Employee benefits will align with DEI goals
Many companies are recognizing the importance of diversity, equity, and inclusion (DEI) in the workplace.
By 2025, this recognition will extend to employee benefits.
Employers will design benefits that promote diversity, equity, and inclusion, recognizing that traditional one-size-fits-all benefits may not equally support all employees.
Aligning benefits with DEI goals encourages a more inclusive workplace culture, addresses disparities in benefits access, and better supports underrepresented groups.
This shift acknowledges that benefits play a critical role in creating a fair and equitable work environment.
FAQs
![80+ Employee Benefit Statistics: Insights and Trends for 2025 80+ Employee Benefit Statistics: Insights and Trends for 2025 [2025] ᐈ Passive Secrets](https://passivesecrets.com/wp-content/uploads/2025/01/Employee-Benefit-Statistics-insights-and-Trends-2-683x1024.jpg)
Other Work-Place Related Statistics You Must Know:
- Most Important Wealth Management Statistics You Can’t Afford to Ignore
- Enterprise Data Management: Essential Statistics and Emerging Trends
- 93 Talent Management Statistics to Help You
- Top Reputation Management Statistics and Trends to Improve Your Brand
- 36 Helpful Social Worker Burnout Statistics To Know
- 100 Business Process Outsourcing Statistics & Facts
- Top HR Outsourcing Statistics and Trends Every Business Must Know
- The Top Outsourcing Statistics You Shouldn’t Ignore
- 47+ Shocking 4-day Work Week Statistics To Know
- 105+ Supply Chain Statistics & Facts You Can’t Ignore
- 50+ Interesting Employer Branding Statistics And Trends
- Job Seekers Statistics: Unemployment Rates, Preferences, Challenges
- 95 Interesting Job Interview Statistics and Huge Trends To Know
- 60+ Helpful Change Management Statistics & Facts
- 65+ Employee Performance Management Statistics & Trends
- Workforce Management Statistics: Trends, Insights, & Opportunities
- 73 Revealing Workplace Distraction Statistics
- Workplace Romance Statistics: How Common Is Workplace Romance?
- 40+ Top Workplace Conflict Statistics You Should Know
- The State of Workplace Communication: Key Statistics and Trends
- 55 Workplace Collaboration & Teamwork Statistics

